EconomicsUnit 1010 min read
Firm Behavior & Profit Maximization: Rules, Models & Real Cases
Unit 10 of Economics explores how firms make decisions under different market structures to maximize profits, covering profit maximization rules, cost-revenue analysis, and equilibrium conditions in perfect competition vs. monopoly—with Nepalese and global examples like Ncell’s pricing and Daraz’s supply chain.
TAKEAWAYS:
- Profit maximization rule: Firms produce where MR = MC (marginal revenue equals marginal cost), not where P = MC.
- Short-run vs. long-run: Firms may operate at a loss short-term (e.g., Daraz during sales) but exit if P < AVC (shutdown rule).
- Monopoly vs. perfect competition: Monopolies restrict output to raise prices (e.g., NTC’s telecom pricing), while perfect competition forces P = MC = AR = MR.
- Profit formulas: Total profit = TR – TC = (P – ATC) × Q; marginal profit = MR – MC.
- Real-world tie: Kathmandu’s traffic congestion (a natural monopoly) shows how government intervention (e.g., metro rail) can break monopolies.
- Exam focus: Always sketch cost-revenue curves (MC, MR, ATC, AR) and mark profit-maximizing quantity/price.
1. Core Concepts: Profit and Decision Rules
Profit is the difference between total revenue (TR) and total cost (TC). Firms aim to maximize it by adjusting quantity (Q) and price (P).
Key Definitions
| Term | Formula | Meaning |
|---|---|---|
| Total Revenue (TR) | Income from selling Q units at price P. | |
| Total Cost (TC) | Fixed costs (TFC) + variable costs (TVC). | |
| Average Revenue (AR) | Revenue per unit (equals price in competitive markets). | |
| Marginal Revenue (MR) | Extra revenue from selling one more unit. | |
| Marginal Cost (MC) | Extra cost of producing one more unit. | |
| Profit (π) | Economic profit (zero in long-run perfect competition). |
Profit Maximization Rule
Firms maximize profit where: Why?
- If , producing more increases profit.
- If , producing less increases profit.
- Exception: If at multiple points (e.g., linear demand), choose the highest point on the MC curve (second-order condition: is rising).
WORKED EXAMPLE: Ncell’s Data Pricing Ncell faces a demand for mobile data: . Its cost function is .
- Find MR and MC:
- Set : → units (GB of data).
- Find : per GB.
- Profit: . Ncell loses money here—why? (Hint: Check AVC for shutdown rule.)
2. Short-Run vs. Long-Run Decisions
Firms face different constraints in the short run (fixed plant capacity) vs. long run (all inputs variable).
Short-Run Equilibrium
- Shutdown Rule: Operate if ; shut down if (cannot cover variable costs).
- Break-even Rule: Operate if ; incur losses if .
- Example: Daraz during Diwali sales may sell at a loss () to gain market share, but shuts down unprofitable warehouses if .
Long-Run Equilibrium
- Firms enter/exit until economic profit = 0 (normal profit).
- Perfect Competition: (price takers).
- Monopoly: (price makers; restrict output to maximize profit).
MERMAID DIAGRAM: Short-run vs. Long-run Decisions
flowchart TD
    A["Short Run"] --> B["Fixed Plant\nP ≥ AVC to operate"]
    A --> C["P < AVC\nShutdown"]
    D["Long Run"] --> E["All inputs variable\nP = min ATC"]
    D --> F["Economic profit = 0\nZero economic profit"]
    E -->|"Perfect Competition"| G["P = MC = AR = MR\nProfit-maximizing Q"]
    E -->|"Monopoly"| H["P > MC\nMR = MC\nProfit-maximizing Q"]
    G -->|"Example"| I["Nepal’s rice market"]
    H -->|"Example"| J["NTC monopoly"]
3. Profit Maximization in Market Structures
A. Perfect Competition
- Features:
- Many small firms (e.g., vegetable farmers in Kathmandu).
- Homogeneous product (e.g., wheat).
- Free entry/exit.
- Price takers ().
- Equilibrium:
- Short run: (may earn supernormal profit).
- Long run: (zero economic profit).
- Example: Nepal’s rice market. If one farmer charges higher than market price, buyers switch to others.
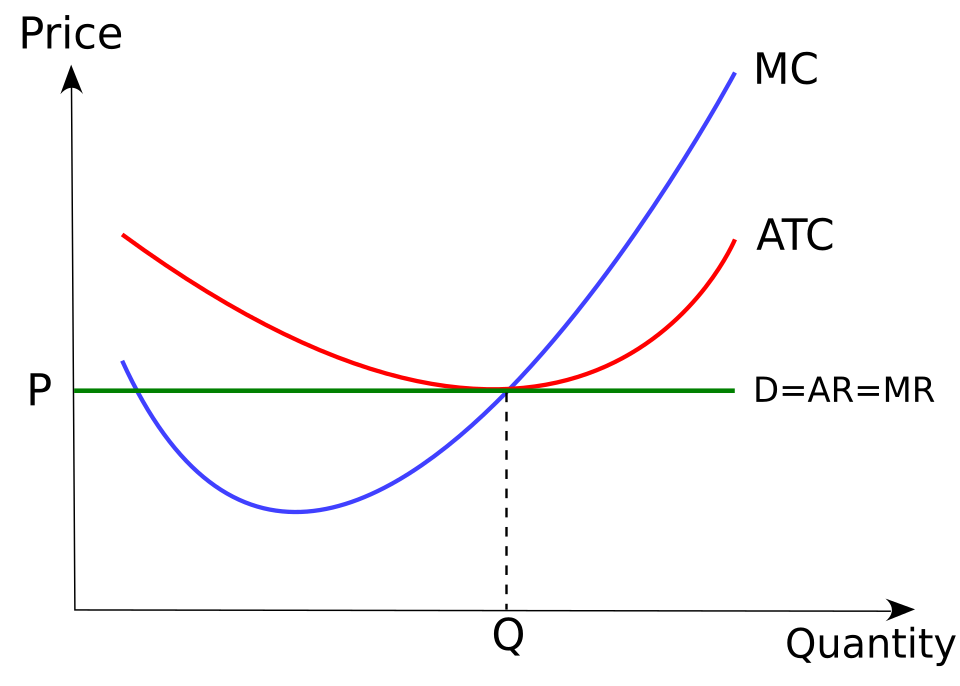 MC, ATC, and horizontal AR=MR=P line intersecting at profit-maximizing Q (Image: Costcurve_-_Combined.png: The original uploader was Trampled, CC BY-SA 3.0, via Wikimedia Commons)
B. Monopoly
- Features:
- Single seller (e.g., NTC in telecom before liberalization).
- Unique product (no close substitutes).
- Barriers to entry (e.g., patents, high startup costs).
- Price maker ().
- Equilibrium:
- (but ).
- Restricts output to raise prices (deadweight loss).
- Example: NTC’s landline monopoly until 2004. Prices were high, and quality was poor due to lack of competition.
MERMAID DIAGRAM: Monopoly vs. Perfect Competition
flowchart LR
    A["Perfect Competition"] --> B["P = MC\nAR=MR=P"]
    A --> C["Many firms\nHomogeneous product"]
    D["Monopoly"] --> E["P > MC\nMR < AR"]
    D --> F["Single firm\nUnique product\nBarriers to entry"]
    E -->|"Example"| G["NTC\nHigh prices, low output"]
    B -->|"Example"| H["Rice market\nP = $5/kg"]
4. Profit Calculation and Break-Even Analysis
Total Profit
Average Profit:
Break-Even Point (BEP)
Occurs where or .
- Graphically: Intersection of AR and ATC curves.
- Algebraically: Solve .
WORKED EXAMPLE: Daraz’s Break-Even Daraz sells a product with:
- Fixed cost (FC) = Rs. 50,000 (warehouse rent).
- Variable cost (VC) = Rs. 200 per unit.
- Selling price (P) = Rs. 500 per unit.
- BEP in units: → → units.
- BEP in revenue: .
5. Applications in Nepal’s Economy
A. Ncell’s Pricing Strategy (Monopoly)
- Before competition, Ncell set prices where , leading to high prices (e.g., Rs. 500 for 1GB data in 2010).
- After NTC’s liberalization, prices dropped to Rs. 50–100/GB due to competition.
B. Daraz’s Supply Chain (Perfect Competition)
- Daraz acts like a price taker for many products (e.g., electronics). If it charges higher than competitors, buyers switch to Sano Commerce or Hamrobazaar.
- Uses economies of scale to lower ATC (e.g., bulk discounts from suppliers).
C. Kathmandu Traffic (Natural Monopoly)
- Public transport (e.g., buses) is a natural monopoly due to high fixed costs (roads, vehicles).
- Government intervention: Metro rail project aims to break the monopoly by introducing competition.
6. Common Mistakes and Clarifications
Confusing with profit maximization:
- Correct: .
- Only in perfect competition does (since ).
Ignoring shutdown rule:
- Example: A tea stall in Thamel may stay open if (e.g., Rs. 100 tea at cost Rs. 50), but closes if (e.g., Rs. 30 tea at cost Rs. 40).
Assuming monopolies always make huge profits:
- Monopolies can have losses if demand is low (e.g., NTC during COVID-19).
## In the Real World
Ncell’s Data Pricing (Monopoly Pricing)
- Before 2004, NTC was the sole telecom provider. It set prices where , leading to high tariffs (e.g., Rs. 1000 for 1GB in 2010). After liberalization, prices dropped to Rs. 50–100/GB due to competition from Ncell and Smart.
Daraz’s Order Fulfillment (Perfect Competition)
- Daraz acts as a price taker for many products (e.g., books, electronics). If it raises prices above competitors like Sano Commerce, buyers switch platforms. Daraz maximizes profit by ensuring for each product category, often using dynamic pricing during sales.
Kathmandu Metro Rail (Natural Monopoly Intervention)
- Public transport in Kathmandu is a natural monopoly due to high fixed costs (roads, vehicles). The government’s metro rail project aims to break this monopoly by introducing a regulated competitor, reducing prices and improving service quality.
## Exam Tip
Always draw curves:
- Sketch MC, MR, ATC, and AR for every question. Mark:
- Profit-maximizing quantity where .
- Shutdown point where .
- Break-even point where .
- Sketch MC, MR, ATC, and AR for every question. Mark:
Memorize key formulas:
- (perfect competition), (monopoly).
- Shutdown rule: .
Compare monopoly vs. perfect competition:
- Use a table with columns: Price, Output, Profit, Efficiency, Example (Nepal).
Real-world examples:
- Relate to Ncell, Daraz, NTC, or Kathmandu traffic in numerical questions. For example:
"Nepal Electricity Authority (NEA) is a monopoly supplier. If its demand is and , find its profit-maximizing price and output."
- Relate to Ncell, Daraz, NTC, or Kathmandu traffic in numerical questions. For example:
Watch for traps:
- Questions may ask for short-run vs. long-run equilibrium. Always check if firms can enter/exit.
- Never assume unless it’s perfect competition.
MERMAID DIAGRAM: Exam Checklist
Based on the TU BIT syllabus for Economics (ECO155), unit 10.
Discussion
Loading…