Artificial IntelligenceUnit 711 min read
Project Management & CASE Tools: SDLC, Planning, Evaluation & Tools
Unit 7 of Artificial Intelligence covers project management fundamentals in software development, including CASE tools, SDLC integration, project evaluation criteria, and practical techniques like network diagrams and Gantt charts—essential for BIT252 exams and real-world IT projects.
TAKEAWAYS:
- CASE tools automate SDLC phases (e.g., requirements analysis, design, testing) by integrating diagrams, code generation, and version control.
- Project selection uses criteria like ROI, strategic alignment, and feasibility to prioritize IT initiatives (e.g., Ncell’s app upgrades vs. NTC’s billing system).
- Network diagrams (e.g., PERT/CPM) visualize task dependencies and critical paths—critical for scheduling projects like eSewa’s payment gateway overhaul.
- Project planning involves defining scope, timelines, resources, and risks (e.g., Daraz’s delivery route optimization using Gantt charts).
- Evaluation metrics (cost-benefit, NPV, risk assessment) help rank projects (e.g., Khalti’s fraud detection system vs. a bank’s loan processing tool).
- Tools like Microsoft Project or JIRA streamline task tracking, but manual methods (e.g., spreadsheets) work for small teams.
1. Introduction to Project Management in IT
Project management in software development ensures timely, budgeted, and quality delivery of IT systems. Key concepts:
- Project: Temporary endeavor with a defined start/end, unique deliverables, and constraints (scope, time, cost, quality).
- Project Manager (PM): Leads teams, mitigates risks, and aligns projects with organizational goals.
- Skills:
- Technical (SDLC, tools like JIRA).
- Soft (communication, negotiation, leadership).
- Analytical (risk assessment, cost-benefit analysis).
- Skills:
2. Systems Development Life Cycle (SDLC) and CASE Tools
SDLC Phases
The waterfall model (sequential phases) or agile (iterative) frameworks guide IT projects. CASE (Computer-Aided Software Engineering) tools automate tasks in each phase:
| SDLC Phase | CASE Tool Support | Example Tools |
|---|---|---|
| Requirements | Diagrams (DFD, UML), surveys, stakeholder analysis | IBM Rational RequisitePro |
| Design | Architecture diagrams, code generation | Microsoft Visio, Enterprise Architect |
| Implementation | IDEs, version control, CI/CD pipelines | Visual Studio, GitLab |
| Testing | Test case automation, bug tracking | Selenium, JIRA |
| Maintenance | Documentation, change logs | Confluence, Doxygen |
Why CASE?
- Pros: Reduces errors, speeds up development, improves documentation.
- Cons: High initial cost, steep learning curve, over-reliance on tools.
Worked Example: NEPSE’s Trading System Upgrade
- Phase: Requirements
- Tool: IBM Rational RequisitePro
- Action: Stakeholders (brokers, regulators) input needs via surveys → CASE tool generates a DFD (Data Flow Diagram).
- Output:
flowchart TD
  A["Broker"] -->|"Place Order"| B["Order System"]
  B -->|"Validate"| C["Database"]
  C -->|"Update"| D["Trading Ledger"]
  D -->|"Notify"| A
- Deliverable: Approved requirements document with traceability matrices.
3. Identifying and Selecting IT Projects
Process
- Generate Ideas: From business needs, technology trends, or customer feedback (e.g., Pathao’s demand for real-time ride tracking).
- Screening: Filter projects using evaluation criteria (see below).
- Prioritization: Rank projects using scoring models (e.g., weighted scoring).
- Approval: Submit to stakeholders for funding.
Evaluation Criteria
| Category | Criteria | Example |
|---|---|---|
| Financial | ROI, NPV, payback period | Ncell’s 5G rollout: NPV = $20M (3-year horizon) |
| Strategic | Alignment with business goals | Daraz’s AI-driven inventory management |
| Technical | Feasibility, risk, existing infrastructure | Khalti’s blockchain integration for security |
| Operational | Impact on workflow, scalability | NTC’s automated billing system to reduce errors |
| Legal/Compliance | Regulatory requirements (e.g., GDPR, Nepal’s data laws) | Bank’s KYC system for loan approvals |
Worked Example: Bank Loan Processing System
- Criteria Scores (1-5):
Criteria Score Weight Weighted Score ROI 4 0.3 1.2 Strategic Fit 5 0.25 1.25 Technical Risk 3 0.2 0.6 Total 3.05 - Decision: Approve if threshold = 3.0.
Deliverables:
- Project charter (scope, objectives, stakeholders).
- Feasibility study report.
- Prioritized project list.
4. Project Planning
Key Activities
- Define Scope: Use WBS (Work Breakdown Structure) to break tasks into deliverables.
- Example: eSewa’s payment gateway upgrade:
- Level 1: System Integration
- Level 2: API Development, Security Patch, User Testing
- Level 1: System Integration
- Example: eSewa’s payment gateway upgrade:
- Schedule: Use Gantt charts or network diagrams (PERT/CPM).
- Resource Allocation: Assign teams/tools (e.g., 2 developers for API, 1 QA tester).
- Risk Management: Identify risks (e.g., third-party API failures) and mitigation plans.
- Budgeting: Estimate costs (e.g., $50K for hardware, $30K for licenses).
Visual: Gantt Chart for Kathmandu Traffic Route Optimization
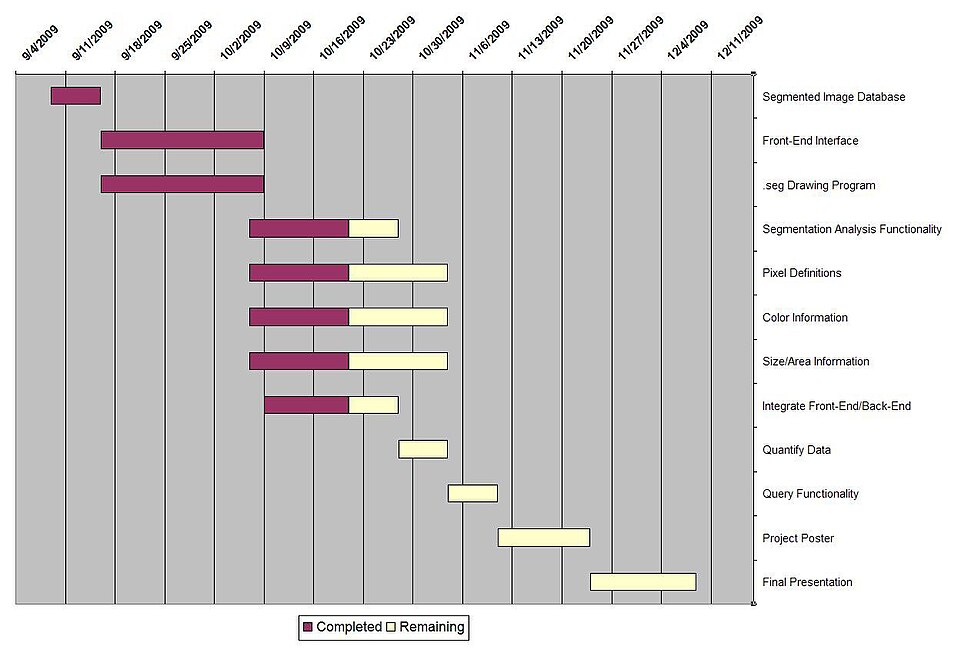
- Tasks:
- Week 1-2: Sensor installation (critical path).
- Week 3-4: AI model training (parallel to data collection).
- Week 5: Pilot testing in Thapathali.
Network Diagram (PERT) for NTC’s Billing System
graph TD
  A["Start"] --> B["Database Migration"]
  A --> C["API Development"]
  B --> D["Integration Testing"]
  C --> D
  D --> E["User Training"]
  E --> F["Go-Live"]
- Critical Path: B → D → E → F (longest duration; delays here affect the project).
5. Project Evaluation and Control
Techniques
Earned Value Management (EVM):
- Metrics:
- PV (Planned Value): Budgeted cost of work scheduled.
- EV (Earned Value): Budgeted cost of work completed.
- AC (Actual Cost): Real cost incurred.
- Example: Daraz’s order fulfillment system.
- PV: $100K (planned for Month 1).
- EV: $80K (actual progress).
- AC: $120K (overspent).
- CPI (Cost Performance Index): EV/AC = 80/120 = 0.67 (underperforming).
- Metrics:
Risk Monitoring: Use risk registers to track issues (e.g., WhatsApp’s end-to-end encryption delays).
Quality Control: Inspections, walkthroughs (e.g., Ncell’s app beta testing with 100 users).
6. CASE Tools in Practice
| Tool | Purpose | Example Use Case |
|---|---|---|
| Microsoft Project | Gantt charts, resource management | NTC’s network upgrade timeline |
| JIRA | Agile task tracking, bug fixes | Pathao’s ride-matching algorithm updates |
| Lucidchart | Diagrams (flowcharts, UML) | Khalti’s fraud detection workflow |
| GitLab | Version control, CI/CD pipelines | Open-source Nepalese AI chatbot development |
In the Real World
eSewa’s Payment Gateway Upgrade
- Idea Used: Network diagrams (PERT) to schedule tasks like API integration (3 weeks), security audits (2 weeks), and user testing (1 week).
- Impact: Reduced go-live time by 20% by identifying the critical path (security audits).
Pathao’s Driver App Redesign
- Idea Used: CASE tool (Lucidchart) to create UML diagrams for the new UI, then JIRA to track developer tasks.
- Real Example:
classDiagram class Driver { +String name +Vehicle vehicle +double currentEarnings +updateLocation() } class Rider { +String name +double budget +requestRide() } class App { +matchDriverRider() +calculateFare() } Driver --> App : uses Rider --> App : uses - Outcome: 30% faster ride-matching due to optimized data flows.
NTC’s Automated Billing System
- Idea Used: Project selection criteria (ROI = 25%, strategic fit = 5/5) to justify $2M investment.
- Worked Example:
- NPV Calculation:
- Year 1: Cost = $800K, Savings = $300K → Net = -$500K
- Year 2: Savings = $500K → Net = $0
- Year 3: Savings = $700K → Net = $700K
- NPV (10% discount rate): -$500K + $454.5K + $558.7K ≈ $503.2K (positive → approve).
- NPV Calculation:
Exam Tip
Diagrams Are Mandatory:
- Draw network diagrams (PERT) or Gantt charts for scheduling questions.
- Example prompt: "Schedule the development of a bank loan system with 5 tasks." → Show dependencies and critical path.
Link Theory to Practice:
- For project selection, always tie criteria to a real scenario (e.g., "Why would Ncell prioritize a fraud detection system over a loyalty app?").
- Use NPV/ROI formulas with small numbers (e.g., $10K project with $3K annual savings).
CASE Tools:
- Memorize one tool per SDLC phase (e.g., Rational RequisitePro for requirements).
- Compare manual vs. CASE methods (e.g., "How would you plan a project without Microsoft Project?" → Use spreadsheets/Gantt templates).
Common Pitfalls:
- Avoid: Vague answers like "CASE tools are useful." Instead, say "CASE tools like Enterprise Architect reduce design errors by 40% in large projects (e.g., NEPSE’s trading system)."
- Do: Use bullet points for evaluation criteria (examiners love structured answers).
Practice Question with Solution
Question: "Explain how you would use a network diagram to schedule the development of a Khalti-like mobile wallet system. Identify the critical path and suggest mitigation strategies for delays."
Solution:
- Tasks and Dependencies:
graph TD
  A["Project Start"] --> B["Requirements Gathering"]
  B --> C["Backend API Development"]
  B --> D["UI/UX Design"]
  C --> E["Database Setup"]
  D --> F["Frontend Development"]
  E --> F
  F --> G["Integration Testing"]
  G --> H["User Testing"]
  H --> I["Deployment"]
- Duration Estimate (weeks):
- B: 2, C: 4, D: 3, E: 2, F: 4, G: 2, H: 1, I: 1.
- Critical Path: B → C → E → F → G → H → I (15 weeks).
- Mitigation: Parallelize D (UI/UX) with C (no dependency).
- Risk: Delay in C (API development) → Solution: Assign senior developers or use a pre-built blockchain library.
Based on the TU BIT syllabus for Artificial Intelligence (BIT252), unit 7.
Discussion
Loading…