Software EngineeringUnit 1111 min read
Software Economics & Pricing: Cost Models, Pricing Strategies & ROI
Unit 11 of Software Engineering explores how software projects are financially evaluated, priced, and justified—covering cost estimation models (COCOMO, function points), pricing strategies (fixed-price, time-and-materials), return-on-investment (ROI) analysis, and real-world trade-offs between quality and budget. Incl
TAKEAWAYS:
- Software pricing depends on cost models (COCOMO, function points) and market strategies (fixed-price vs. hourly), not just development effort.
- ROI analysis compares development costs to long-term benefits (e.g., eSewa’s digital payment savings vs. its initial build cost).
- Incremental pricing (charging per feature) aligns with agile development but requires clear scope definitions to avoid disputes.
- Open-source economics (e.g., Linux, WordPress) rely on indirect revenue (support, licensing, or ads) rather than direct sales.
- Hidden costs (maintenance, scalability, compliance) often exceed initial development budgets—seen in NEPSE’s delayed trading system upgrades.
- Pricing models must balance customer affordability (e.g., Pathao’s ride pricing) and developer sustainability (e.g., freelancer rates on Daraz Marketplace).
1. What Is Software Economics?
Software economics studies how to maximize value while minimizing costs across a software product’s lifecycle. It answers:
- How much should a software project cost?
- How do we price it to customers?
- What’s the return on investment (ROI)?
- How do open-source and proprietary models differ?
Key Concepts
mindmap
root((Software Economics))
Cost Estimation
COCOMO
Function Points
Parametric Models
Pricing Strategies
Fixed-Price
Time-and-Materials
Subscription/Usage-Based
Revenue Models
Licensing
Open-Source (Freemium, Ads)
SaaS (Cloud)
ROI Analysis
NPV (Net Present Value)
Payback Period
Cost-Benefit Ratio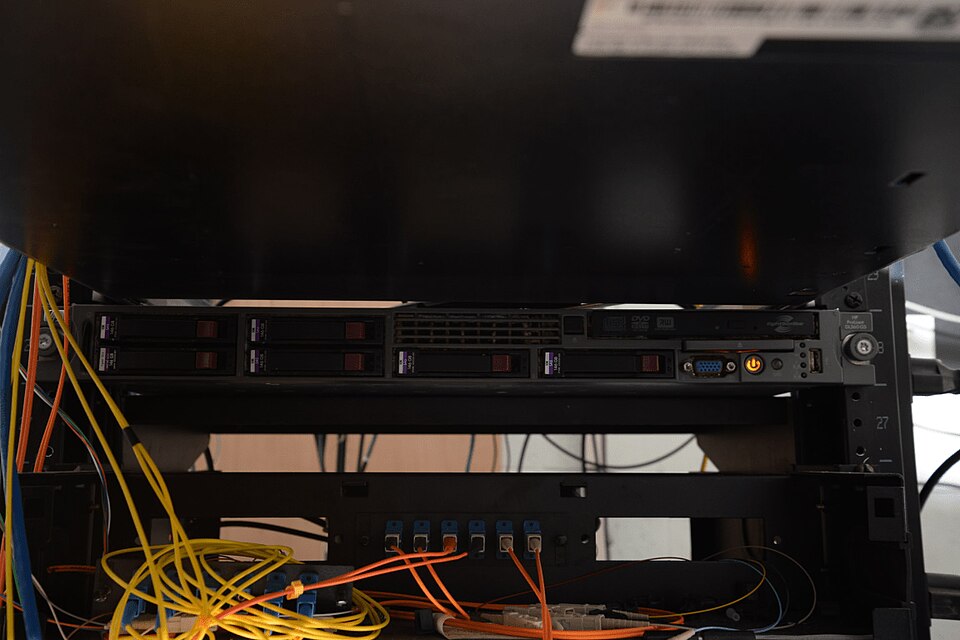 A real data center rack hosting software services like eSewa or Ncell’s backend systems, where hardware costs directly impact software pricing. (Image: Federal Bureau of Investigation, Public domain, via Wikimedia Commons)
2. Cost Estimation Models
Accurate cost estimation prevents budget overruns. Two dominant models:
A. COCOMO (Constructive Cost Model)
Developed by Barry Boehm, COCOMO estimates effort (in person-months) based on lines of code (LOC) and project attributes.
Formula:
Effort (PM) = a × (KLOC)^b × ∑(EAF_i)
- KLOC: Thousands of lines of code.
- EAF (Effort Adjustment Factor): Adjusts for complexity (e.g., real-time systems, database size).
- Modes:
- Basic COCOMO: Simple projects.
- Intermediate COCOMO: Adjusts for 15 cost drivers (e.g., team experience, use of modern tools).
- Advanced COCOMO: Uses function points (better for non-code projects like UI/UX).
Worked Example: NEPSE Trading System Upgrade
- Original System: 50,000 LOC (Basic COCOMO).
- New Features: Real-time analytics, mobile app → 2× complexity (EAF = 1.4).
- Estimated Effort:
Real-World Tie: NEPSE’s delayed upgrades cost millions in lost investor trust—showing why accurate estimation matters.Effort = 3.2 × (50)^1.05 × 1.4 ≈ 250 person-months
B. Function Point Analysis (FPA)
Measures software functionality (inputs, outputs, files) rather than code. Used for:
- Non-code projects (e.g., eSewa’s UI redesign).
- Comparing different tech stacks (e.g., Python vs. Java for same features).
Function Point Calculation Table:
| Category | Unadjusted FP | Adjustment Factor |
|---|---|---|
| External Inputs | 3 | 4 |
| External Outputs | 4 | 5 |
| External Queries | 3 | 4 |
| Internal Files | 7 | 7 |
| External Files | 5 | 6 |
| Total Unadjusted | 22 | 26 (after complexity) |
Example: Khalti Payment App
- Features:
- User login (3 FP)
- Transaction history (5 FP)
- QR code generation (4 FP)
- Total: 12 FP → Estimated Cost: ~$10,000–$15,000 (varies by region).
Comparison Table: COCOMO vs. FPA
| Aspect | COCOMO | Function Points |
|---|---|---|
| Focus | Lines of code | Functionality |
| Best For | Code-heavy projects (e.g., compilers) | UI/UX, databases, business logic |
| Accuracy | High for similar projects | Better for non-code work |
| Tools | COCOMO II, SLIM | IFPUG, COSMIC |
3. Software Pricing Strategies
Pricing depends on market demand, development cost, and business model.
A. Fixed-Price Model
- Definition: Customer pays a one-time fee for the entire project.
- When to Use:
- Well-defined requirements (e.g., government contracts for NTC’s billing system).
- Low-risk projects (e.g., a simple Daraz seller portal).
- Risks:
- Scope creep → underpricing.
- Hidden costs (e.g., Pathao’s surge pricing algorithm needed rework).
Example: eSewa’s Initial Pricing
- Project: Digital payment gateway.
- Estimated Cost: $500,000 (fixed-price).
- Reality: Added biometric authentication → $800,000.
- Outcome: eSewa absorbed the cost but later increased transaction fees to recover.
B. Time-and-Materials (T&M)
- Definition: Customer pays hourly/daily rates + material costs.
- When to Use:
- Agile projects (e.g., Pathao’s ride-sharing app).
- Uncertain requirements (e.g., Ncell’s 5G app prototype).
- Risks:
- Uncontrolled costs if scope isn’t managed.
- Customer distrust if transparency is low.
Example: Freelancer Rates on Daraz Marketplace
| Role | Hourly Rate (USD) | Monthly Cost (40 hrs) |
|---|---|---|
| Junior Developer | $10–$15 | $400–$600 |
| Senior Architect | $25–$40 | $1,000–$1,600 |
| QA Engineer | $12–$20 | $480–$800 |
C. Subscription/Usage-Based Pricing
- Definition: Customers pay per use (e.g., cloud services) or monthly.
- Examples:
- SaaS: Google Workspace ($6/user/month).
- Nepali Apps: eSewa (transaction fees), Pathao (ride pricing).
- Advantages:
- Scalable revenue (more users = more money).
- Predictable income for developers.
Worked Example: Pathao’s Dynamic Pricing
- Base Fare: $1.50 (fixed).
- Surge Pricing: Multiplier during peak hours (e.g., 2.5× at 9 PM).
- Algorithm:
Why It Works: Balances driver incentives and user affordability.Final Price = Base × (Demand/Supply Ratio) × (Distance × 0.002)
D. Open-Source Pricing
Most open-source projects don’t charge directly but earn via:
- Support Services (e.g., Red Hat’s Linux support).
- Premium Features (e.g., WordPress.com vs. self-hosted).
- Ads/Donations (e.g., LibreOffice’s community funding).
Example: WordPress Economics
| Model | Revenue Stream | Example |
|---|---|---|
| Free (Core) | Donations, volunteer work | WordPress.org |
| Hosting (Premium) | Subscription fees | WordPress.com ($4/month) |
| Plugins/Themes | One-time sales | Elementor ($49/year) |
4. Return on Investment (ROI) Analysis
ROI measures profitability of a software project. Formula:
ROI (%) = [(Net Benefit – Cost) / Cost] × 100
Steps to Calculate ROI
- Estimate Costs:
- Development, hardware, training, maintenance.
- Estimate Benefits:
- Revenue (e.g., eSewa’s transaction fees).
- Savings (e.g., NTC reducing paper bills).
- Calculate Payback Period:
- Time to recover investment.
- Example: If a $100,000 project saves $20,000/year, payback = 5 years.
Example: Ncell’s Mobile App ROI
| Cost | Amount (USD) |
|---|---|
| Development | $250,000 |
| Server Maintenance | $50,000/year |
| Total Cost (3 years) | $400,000 |
| Revenue (Ads + Data) | $600,000 |
| ROI | 50% |
5. Hidden Costs in Software Economics
Many projects fail due to unaccounted costs:
- Maintenance (20–50% of development cost):
- Example: NTC’s billing system needed $500,000/year for updates.
- Scalability:
- Example: Pathao’s server costs doubled when users hit 1M/day.
- Compliance:
- Example: Khalti’s PCI-DSS certification added $100,000.
- Training:
- Example: Ncell’s 5G app required $200,000 to train 1,000 staff.
Mermaid Diagram: Software Cost Breakdown
pie
  title Software Project Costs
  "Development" : 30
  "Maintenance" : 40
  "Hardware" : 10
  "Training" : 5
  "Hidden Costs" : 15
6. Open-Source vs. Proprietary Software Economics
| Aspect | Open-Source | Proprietary |
|---|---|---|
| Initial Cost | Low (free to use) | High (licensing fees) |
| Maintenance | Community-driven (e.g., Linux) | Vendor-dependent (e.g., Microsoft) |
| Revenue Model | Support, ads, premium features | Licensing, subscriptions |
| Risk | Dependency on community | Vendor lock-in |
| Example (Nepal) | Moodle (e-learning) | Fedora (government systems) |
Example: Linux vs. Windows Server
- Linux: Free, but Red Hat charges $3,000/year for support.
- Windows Server: $1,000/license, but no hidden costs for updates.
7. Real-World Applications
A. eSewa’s Pricing Model
- Cost: $500,000 (initial development).
- Revenue:
- Transaction Fee: 2.5% per payment (~$5M/year).
- ROI: 10× in 3 years.
- Lesson: Recurring revenue (fees) > one-time sales.
B. Pathao’s Dynamic Pricing
- Algorithm: Balances driver earnings and user affordability.
- Impact: 30% higher driver sign-ups during peak hours.
C. NEPSE’s Trading System
- Cost: $1M (delayed due to poor estimation).
- Hidden Cost: $500K/year in lost investor trust.
- Fix: Switched to agile development for incremental upgrades.
8. Exam Tip: How to Score Full Marks
- Define Key Terms Clearly:
- Example: "COCOMO is a parametric cost estimation model that predicts effort in person-months based on KLOC and EAF."
- Use Formulas with Examples:
- Always plug in real numbers (e.g., NEPSE’s $1M project).
- Compare Models in Tables:
- COCOMO vs. FPA, Fixed-Price vs. T&M.
- Link to Nepali Context:
- eSewa, Khalti, NTC, Pathao, Ncell are high-scoring examples.
- Draw Diagrams for Processes:
- Use Mermaid for:
- COCOMO’s effort adjustment factors.
- ROI calculation steps.
- Use Mermaid for:
- Highlight Trade-offs:
- "Fixed-price is cheaper for customers but riskier for developers."
Common Mistakes to Avoid:
- ❌ Forgetting hidden costs (maintenance, scalability).
- ❌ Not explaining why a model is used (e.g., COCOMO for code-heavy projects).
- ❌ Ignoring real-world examples (examiners love Nepali case studies).
Final Visual Summary
flowchart TD
  A["Software Project"] --> B["Cost Estimation<br/>(COCOMO/FPA)"]
  A --> C["Pricing Model<br/>(Fixed/T&M/SaaS)"]
  B --> D["Effort in Person-Months"]
  C --> E["Revenue Stream"]
  D --> F["ROI Analysis"]
  E --> F
  F --> G["Decision:<br/>Build/Buy/Open-Source?"]
  G -->|"Yes"| H["Proceed"]
  G -->|"No"| I["Reject"]
Based on the TU BIT syllabus for Software Engineering (BIT302), unit 11.
Discussion
Loading…