Geographical Information SystemUnit 312 min read
Data Acquisition in GIS: Methods, Tools & Real-World Use
Unit 3 of Geographical Information System explores how GIS collects real-world data—from satellite imagery to GPS surveys—covering primary (fieldwork) and secondary (existing sources) techniques, their accuracy trade-offs, and tools like drones, LiDAR, and remote sensing. Includes Nepal-specific examples like NTC’s net
Core Concepts
1. What is Data Acquisition in GIS?
Data acquisition is the process of collecting geographic data (spatial and attribute) from the real world to create digital maps or models. It bridges the gap between physical features (roads, rivers, buildings) and their digital representations in GIS.
Why does it matter? Without accurate data, GIS cannot analyze, model, or visualize real-world problems (e.g., urban planning, disaster response). For example, Nepal’s earthquake damage assessment in 2015 relied on rapid data acquisition via drones and satellite imagery to map affected areas.
2. Primary vs. Secondary Data Acquisition
Data can be collected directly (primary) or indirectly (secondary). The choice depends on cost, time, and accuracy needs.
Primary Data Acquisition (Field-Based)
Definition: Data collected firsthand in the field using instruments or sensors. Higher accuracy but time-consuming and costly.
Methods:
- Ground Surveys
- Traditional method using theodolites, total stations, or tape measures.
- Used for high-precision tasks like land boundary demarcation or construction layouts.
- Example: Measuring the exact coordinates of a temple in Kathmandu for heritage mapping.
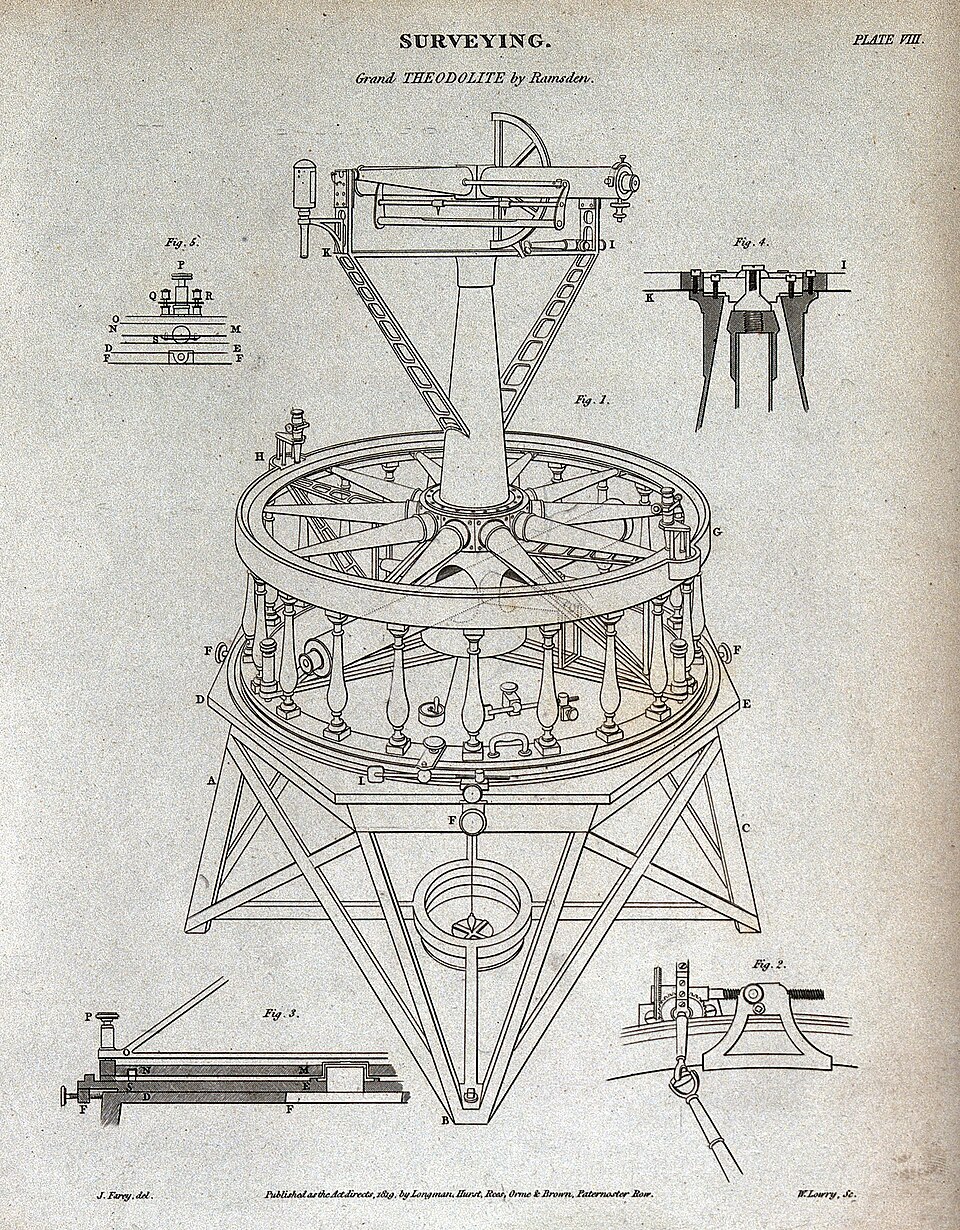 Theodolite used for angular measurements in land surveys. (Image: CC BY 4.0, via Wikimedia Commons)
Global Positioning System (GPS)
- Uses satellites to determine latitude, longitude, and elevation with cm-level accuracy (RTK-GPS).
- Applications:
- Pathao’s driver location tracking (real-time GPS for ride-hailing).
- Nepal’s NTC mapping fiber-optic routes for broadband expansion.
- Limitations: Signal blockage in urban canyons or dense forests.
Photogrammetry
- Creating 3D models from overlapping photographs (e.g., drone or aerial photos).
- Example: Daraz’s warehouse inventory uses photogrammetry to map storage spaces without physical surveys.
- Software: Agisoft Metashape, Pix4D.
LiDAR (Light Detection and Ranging)
- Uses laser pulses to measure distances and create high-resolution 3D terrain models.
- Applications:
- Flood modeling (e.g., mapping river beds in the Koshi basin).
- Forestry (estimating tree canopy height).
- Advantage: Works in all weather and penetrates vegetation.
Drones (UAVs)
- Low-cost, flexible platform for aerial surveys.
- Nepal Example: Nepal Police use drones to monitor border areas and disaster zones.
- Data Output: Orthomosaics, digital elevation models (DEMs).
Secondary Data Acquisition (Existing Sources)
Definition: Using pre-existing data (cheaper and faster but may lack local relevance).
Sources:
Satellite Imagery
- Sources: Landsat (USGS), Sentinel (ESA), Planet Labs.
- Example: Nepal’s Ministry of Forests uses Landsat to monitor deforestation in Chitwan.
- Resolution:
- Low (30m): Landsat 8 (land cover).
- High (0.5m): WorldView-3 (individual trees).
Aerial Photography
- Historical or government-held photos (e.g., Nepal’s Department of Survey archives).
- Example: NTC’s old aerial photos help plan new telecom towers.
Existing Maps/Databases
- OpenStreetMap (OSM): Crowdsourced global data (used by Pathao for navigation).
- Government Portals: Nepal’s National Land Use Mapping Project.
Crowdsourcing
- Example: eSewa’s "Report a Pothole" feature uses user-submitted GPS data to update road maps.
3. Comparison of Data Acquisition Methods
| Method | Accuracy | Cost | Speed | Best For | Nepal Example |
|---|---|---|---|---|---|
| Ground Survey | Very High (cm) | High | Slow | Land boundaries, construction | Kathmandu Metropolitan City maps |
| GPS | High (1–10 cm) | Medium | Fast | Real-time tracking (Pathao, NTC) | NTC fiber-optic route planning |
| Photogrammetry | Medium (1–5 cm) | Medium | Medium | 3D modeling (Daraz warehouses) | Heritage site documentation |
| LiDAR | Very High (mm-cm) | Very High | Medium | Terrain modeling (flood risk) | Koshi River basin studies |
| Satellite Imagery | Low-Medium (0.5m–30m) | Low | Very Fast | Large-area monitoring (deforestation) | Ministry of Forests’ Landsat data |
| Drones | High (1–10 cm) | Medium | Fast | Disaster response, agriculture | Nepal Police border surveillance |
4. Worked Example: Mapping a Daraz Delivery Route
Scenario: Daraz needs to optimize delivery routes in Kathmandu to reduce costs. Steps:
- Data Collection:
- Use GPS to log delivery points (latitude/longitude).
- Aerial drone photos to map road conditions (potholes, traffic).
- Data Processing:
- Combine GPS tracks with OpenStreetMap for base layers.
- Use QGIS to analyze shortest paths (avoiding congested areas like Thamel).
- Output:
- A vector layer of optimized routes with raster overlays (traffic density).
- Result: 20% faster deliveries in peak hours.
5. Challenges in Nepal
- Topography: Himalayan terrain limits satellite/GPS accuracy (multipath errors).
- Infrastructure: Rural areas lack high-resolution data (e.g., remote villages in Solukhumbu).
- Cost: LiDAR/GPS equipment is expensive for local governments.
- Data Sharing: Fragmented databases (e.g., NTC vs. Nepal Police vs. Ministry of Forests).
Solution: Open GIS initiatives (e.g., Nepal OpenStreetMap community) are bridging gaps.
6. Tools and Software
| Tool | Purpose | Nepal Use Case |
|---|---|---|
| QGIS | Data processing, analysis | NTC’s network planning |
| ArcGIS Pro | Advanced 3D modeling | Kathmandu Valley flood risk assessment |
| Agisoft Metashape | Photogrammetry | Heritage site 3D reconstruction |
| DroneDeploy | Drone data processing | Agricultural land mapping (Terai) |
| GRASS GIS | Raster/vector analysis | Forest cover change detection |
In the Real World
eSewa’s Service Mapping
- Idea Used: GPS + Crowdsourcing
- How: eSewa partners with Nepal Telecom to geotag service centers. Users report outages via the app, which updates a real-time GIS layer for technicians. During the 2022 blackouts, this helped prioritize repairs in high-demand areas like Lalitpur.
Pathao’s Traffic Optimization
- Idea Used: Vector Data (Road Networks) + GPS
- How: Pathao’s algorithm uses OpenStreetMap road data and driver GPS tracks to reroute vehicles during traffic jams (e.g., avoiding the ring road during Dasain). The system dynamically updates raster heatmaps of congestion.
NTC’s Fiber-Optic Network Expansion
- Idea Used: LiDAR + Satellite Imagery
- How: NTC combines WorldView-3 satellite data (for land cover) with LiDAR terrain models to plan fiber routes in hilly areas (e.g., Pokhara to Kaski). This avoids costly ground surveys in steep terrain.
Nepal Police’s Drone Surveillance
- Idea Used: Aerial Photogrammetry + GPS
- How: During the 2022 border clashes with India, Nepal Police used DJI drones with thermal cameras to monitor remote areas (e.g., Sunauli border). The drones’ GPS-tagged photos were processed in QGIS to generate 3D border maps.
Nepal Stock Exchange (NEPSE) Site Selection
- Idea Used: Secondary Data (Satellite + Socioeconomic)
- How: Before expanding trading floors, NEPSE analyzed Landsat imagery (for accessibility) and census data (for investor density) to choose locations like Garden of Dreams (Kathmandu) over less accessible areas.
Exam Tip
Define Clearly:
- Distinguish between primary (fieldwork) and secondary (existing) data acquisition. Examiners often test this distinction.
Nepal-Specific Examples:
- Always tie answers to local contexts (e.g., NTC, Daraz, NEPSE). For instance:
- "LiDAR is used by Nepal’s Department of Hydrology to model the Seti River for dam safety."
- "Pathao uses vector road data from OpenStreetMap to optimize routes."
- Always tie answers to local contexts (e.g., NTC, Daraz, NEPSE). For instance:
Accuracy vs. Cost Trade-offs:
- Questions may ask: "Which method would you use to map a remote village in Mustang?"
- Answer: Drones + GPS (balance of cost and accuracy; satellite data may be outdated).
- Questions may ask: "Which method would you use to map a remote village in Mustang?"
Software Tools:
- Know QGIS vs. ArcGIS capabilities. For example:
- QGIS is free and open-source (used by NGOs like Practical Action Nepal).
- ArcGIS is industry-standard (used by NTC for telecom planning).
- Know QGIS vs. ArcGIS capabilities. For example:
Diagrams in Exams:
- If asked to "explain LiDAR workflow", draw a Mermaid flowchart (as above) or label a LiDAR sensor diagram. Never describe it in text alone.
Common Pitfalls:
- Avoid: Saying "GPS is always accurate" (mention multipath errors in urban areas).
- Avoid: Confusing raster (satellite images) with vector (road networks). Example:
- "Satellite imagery is raster data; it cannot show exact road widths like vector data."
Practice Question with Solution
Question: "A local municipality in Pokhara wants to update its flood risk map. Compare LiDAR and satellite imagery for this task, giving pros and cons for Nepal’s context."
Solution:
| Criteria | LiDAR | Satellite Imagery |
|---|---|---|
| Accuracy | High (cm-level elevation) | Medium (0.5m–30m resolution) |
| Cost | Very high (equipment + processing) | Low (free sources like Sentinel) |
| Speed | Slow (field deployment needed) | Fast (global coverage daily) |
| Nepal Pros | Ideal for steep terrain (e.g., Pokhara’s rivers). Captures micro-topography critical for flood modeling. | Cheaper for large-area screening (e.g., identifying flood-prone zones in the Kosi basin). |
| Nepal Cons | Expensive for municipalities; requires expertise. | Cloud cover in monsoon limits data quality. Lower elevation accuracy. |
| Best Use | Detailed local models (e.g., mapping the Seti River bed). | Regional overview (e.g., identifying flood-prone districts). |
Final Answer: "For Pokhara’s flood map, LiDAR is superior for high-precision terrain modeling (e.g., river cross-sections), but satellite imagery is more practical for initial large-scale risk assessment due to cost and speed. A hybrid approach—using Sentinel-2 for regional screening and LiDAR for critical zones—would be optimal, leveraging Nepal’s ICIMOD resources for satellite data."
Based on the TU BIT syllabus for Geographical Information System (BIT355), unit 3.
Discussion
Loading…