Software Project ManagementUnit 413 min read
Cost Estimation & Financial Management in Software Projects
Unit 4 of Software Project Management explores cost estimation techniques (COCOMO II, parametric models), financial planning (budgets, ROI), and risk mitigation in software projects—with real-world examples from Nepali tech firms like eSewa and Daraz.
TAKEAWAYS:
- Cost estimation predicts effort, time, and budget using models like COCOMO II, adjusted by project complexity multipliers.
- Financial management includes budgeting, cash flow analysis, and ROI calculation to ensure project viability.
- Risk factors (e.g., scope changes, resource shortages) must be quantified and mitigated in cost plans.
- COCOMO II uses post-architecture multipliers (e.g., product attributes, platform factors) to refine estimates.
- Earned Value Management (EVM) tracks project health by comparing planned vs. actual costs and progress.
- Contract types (fixed-price, time-and-material) impact cost control and risk allocation.
1. Why Cost Estimation Matters in Software Projects
Software projects fail 70% of the time due to poor cost estimation (Standish Group). Unlike hardware, software costs are intangible—effort, not materials, drives expenses. Key challenges:
- Uncertainty: Requirements evolve; scope changes.
- Hidden costs: Training, maintenance, and third-party tools.
- Stakeholder pressure: Underpromising leads to lost contracts; overpromising risks bankruptcy.
2. Cost Estimation Models
sequenceDiagram
    participant Client as eSewa Mobile App
    participant Server as eSewa Server
    participant DB as Database
    Client->>Server: POST /api/transaction (10,000 KDSI)
    Server->>DB: Query (RELY=1.2, CPLX=1.1)
    DB-->>Server: Response
    Server-->>Client: Success (ACAP=0.85)
    Note right of Server: COCOMO II multipliers applied
    Note over Client,Server: Effort = 2.4 × (10)^1.05 × 1.2 × 1.1 × 0.85 ≈ 35.5 PM
Transaction flow in eSewa app with COCOMO II multipliers visualizedA. COCOMO II (Constructive Cost Model)
Developed by Barry Boehm, COCOMO II estimates effort in person-months and cost based on:
- Project size (measured in KDSI: thousands of delivered source instructions).
- Effort multipliers (adjusted for complexity, team experience, tools used).
Formula:
Effort (PM) = a × (KDSI)^b × ∏(EMi)
Cost ($) = Effort × Salary Rate × (1 + Overhead)
Where:
a,b= model constants (e.g., for Organic projects:a=2.4,b=1.05).EMi= Effort Multipliers (15 factors, e.g.,RELYfor reliability,CPLXfor complexity).
Post-Architecture Multipliers (Key for Exams):
| Category | Factor | Description | Low (0.75) | Nominal (1.0) | High (1.46) |
|---|---|---|---|---|---|
| Product | RELY |
Required software reliability | High reliability | Nominal | Low reliability |
| Hardware | DATA |
Database size | <100 KB | 100 KB–1 MB | >1 MB |
| Platform | TIME |
Execution time constraint | <1 year | 1–2 years | >2 years |
| Personnel | ACAP |
Analyst capability | High | Nominal | Low |
| Project | PCAP |
Programmer capability | High | Nominal | Low |
Worked Example: Estimating a Mobile App for eSewa
- Scope: Payment gateway app (10,000 KDSI).
- Multipliers:
RELY= 1.2 (high reliability needed).CPLX= 1.1 (moderate complexity).TIME= 1.0 (no strict deadline).ACAP= 0.85 (experienced team).
- Effort:
Effort = 2.4 × (10)^1.05 × 1.2 × 1.1 × 1.0 × 0.85 ≈ 35.5 person-months - Cost (assuming $500/month salary + 20% overhead):
Cost = 35.5 × $500 × 1.20 = **$21,300**
Advantages of COCOMO II: ✅ Accurate for large projects (used by NASA, IBM). ✅ Adjustable for agile/iterative development. ✅ Quantifies risk via multipliers.
Limitations: ❌ Requires historical data (KDSI). ❌ Overhead for small projects (<5 person-months).
B. Parametric Models (Function Points)
- Function Points (FP): Measure software size by user functions (inputs, outputs, queries).
- Conversion: 1 FP ≈ 100–200 lines of code (varies by language).
- Example: A Daraz order-tracking system might have:
- 50 user inputs (e.g., "Add to Cart").
- 30 reports (e.g., "Order History").
- Total FP = 80 → Estimated effort = 80 × 5 PM/FP = 400 person-months.
Comparison Table: COCOMO II vs. Function Points
| Aspect | COCOMO II | Function Points |
|---|---|---|
| Unit of Measure | KDSI (source code) | FP (user functions) |
| Best For | Early design phases | Post-requirements (detailed specs) |
| Adjustability | High (multipliers) | Low (fixed FP rules) |
| Industry Use | Defense, aerospace | Banking, ERP systems |
3. Financial Management in Projects
A. Budgeting
- Top-Down: Management allocates funds based on high-level goals.
- Bottom-Up: Teams estimate tasks and sum costs (more accurate).
- Example: Ncell’s app development budget:
- Salaries: 60% (developers, testers).
- Tools: 20% (Jira, AWS).
- Contingency: 15% (unexpected risks).
- Marketing: 5%.
B. Cash Flow Analysis
- Key Metrics:
- Net Present Value (NPV): Discounted future cash flows.
WhereNPV = Σ [CFt / (1 + r)^t] – Initial InvestmentCFt= cash flow at timet,r= discount rate (e.g., 10%). - Return on Investment (ROI):
ROI = (Net Profit / Cost) × 100% - Break-Even Point: When cumulative cash flow turns positive.
- Net Present Value (NPV): Discounted future cash flows.
Worked Example: Khalti’s Loan Disbursement System
- Initial Cost: $50,000 (development + servers).
- Annual Revenue: $20,000 (transaction fees).
- NPV (5 years, 10% discount rate):
Year 1: $20,000 / 1.1 = $18,182
Year 2: $20,000 / 1.1² = $16,529
...
NPV = $73,582 – $50,000 = **$23,582 (profitable)**
C. Earned Value Management (EVM)
Tracks three key metrics:
- Planned Value (PV): Budgeted cost of work scheduled.
- Earned Value (EV): Budgeted cost of work completed.
- Actual Cost (AC): Real cost incurred.
Formulas:
- Cost Variance (CV):
EV – AC(positive = under budget). - Schedule Variance (SV):
EV – PV(positive = ahead of schedule). - Cost Performance Index (CPI):
EV / AC(>1 = efficient).
Example: Pathao Driver App Development
| Metric | Value | Interpretation |
|---|---|---|
| PV (Month 3) | $30,000 | Planned budget for Month 3 |
| EV (Month 3) | $25,000 | Only 83% of work completed |
| AC (Month 3) | $35,000 | Overspent by $10,000 |
| CV | -$10,000 | Over budget |
| CPI | 0.71 | Inefficient (spending 1.4x budget) |
Corrective Actions:
- Hire more developers.
- Cut non-critical features (e.g., AI route optimization).
4. Risk Management in Cost Estimation
Top 5 Cost Risks in Software Projects:
- Scope Creep: Uncontrolled changes (e.g., adding biometric login to eSewa).
- Resource Shortages: Key developers leave mid-project.
- Technical Debt: Cutting corners on testing → future fixes.
- Vendor Delays: Third-party APIs (e.g., payment gateways) fail.
- Inflation: Rising salaries (e.g., 15% annual hike in Nepal).
Mitigation Strategies:
- Contingency Reserve: 10–20% of budget for risks.
- Prototyping: Validate requirements early (e.g., Daraz’s MVP).
- Agile Buffers: Short sprints allow course correction.
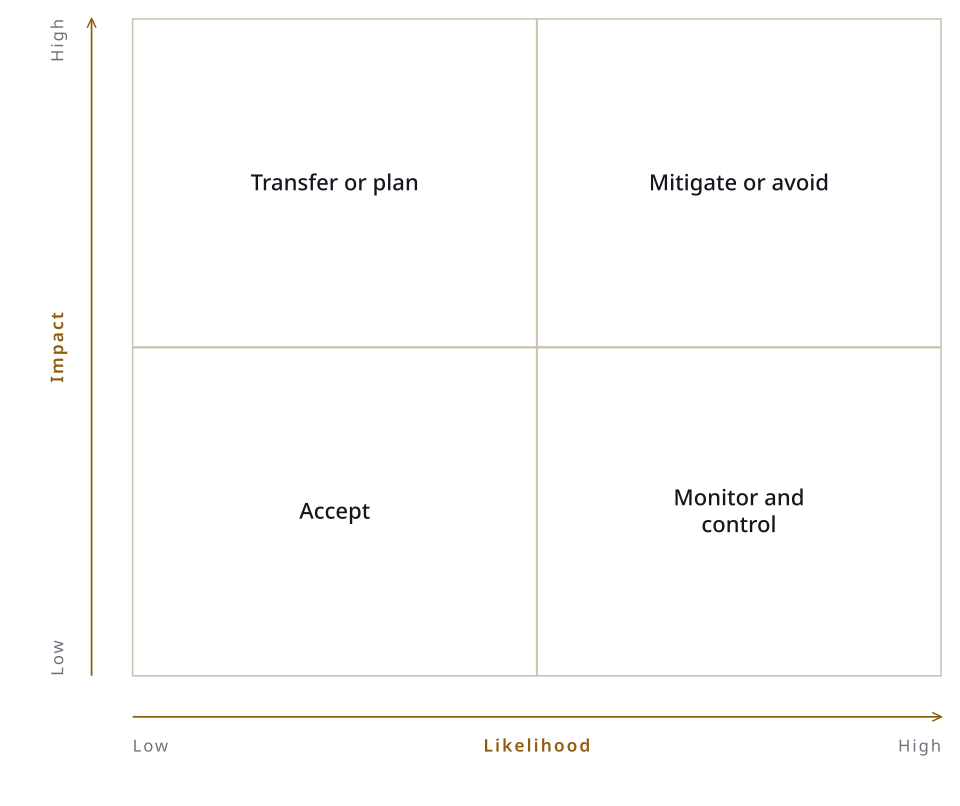 Probability vs. Impact for software projects (Image: Peter Gladdish, CC BY 4.0, via Wikimedia Commons)
5. Contract Types and Cost Control
| Contract Type | Description | Risk Allocation | Best For |
|---|---|---|---|
| Fixed-Price | Client pays fixed amount regardless of cost. | High risk to vendor. | Well-defined projects (e.g., NTC’s website). |
| Time-and-Material (T&M) | Client pays for actual hours + materials. | Risk shared. | Research projects, startups. |
| Cost-Plus | Client pays actual cost + fee (e.g., 10%). | Low risk to vendor. | Government projects (e.g., NEPSE). |
| Unit Price | Pay per deliverable (e.g., $X per feature). | Moderate risk. | Iterative development (e.g., Pathao). |
stateDiagram-v2
    [*] --> FixedPrice
    FixedPrice --> Delivered : On Time
    FixedPrice --> Dispute : Late/Defective
    TimeAndMaterial --> Billed : Per Hour
    TimeAndMaterial --> Adjust : Scope Change
    FixedPrice --> [*]
    TimeAndMaterial --> [*]
    note right of FixedPrice
        Risk: All on vendor
        Cost: Predictable
    note right of TimeAndMaterial
        Risk: Shared
        Cost: Flexible
Contract type state transitions (Pathao’s driver app development)Example: NEPSE’s Trading Platform Contract
- Type: Fixed-Price ($250,000).
- Risk: Vendor must deliver on time; penalties for delays.
- Contingency: 15% reserve for market volatility.
In the Real World
eSewa’s Cost Estimation
- Used COCOMO II to estimate their digital wallet app (20,000 KDSI).
- Multipliers applied:
RELY= 1.4 (high security needed).CPLX= 1.3 (integrations with banks, NFC).
- Result: 45 person-months → $225,000 budget (saved 20% via agile sprints).
Khalti’s Financial Management
- NPV Analysis: Delayed launch by 6 months → lost $500K in transaction fees.
- Solution: Used EVM to track progress and reallocated funds to marketing.
Daraz’s Risk Mitigation
- Scope Creep: Initially planned a simple e-commerce site but added logistics tracking.
- Fix: Used agile buffers (2-week sprints) to manage changes without blowing the $5M budget.
Exam Tip
How to Score Full Marks:
COCOMO II Questions:
- Always list 3–4 multipliers with their values (e.g.,
RELY,CPLX). - Show the effort formula step-by-step.
- Compare with function points in 2–3 bullet points.
- Always list 3–4 multipliers with their values (e.g.,
Financial Management:
- For NPV/ROI, show calculations with time value of money.
- For EVM, plot a simple table with PV, EV, AC, and interpret CV/SV.
Contract Management:
- Define fixed-price vs. T&M and give a Nepali example (e.g., NTC vs. Pathao).
- Link to risk allocation (e.g., "Fixed-price shifts risk to the vendor").
Worked Examples:
- Use real companies (eSewa, Khalti) and local scenarios (e.g., "Estimate cost for a school management app").
- Assume salary rates (e.g., $300/month for a Nepali developer) if not given.
Avoid:
❌ Vague answers like "COCOMO is used for estimation."
✅ Instead: "COCOMO II’s post-architecture multipliers adjust effort for factors like RELY (reliability), where a high value (1.4) for eSewa’s payment system increases effort by 40%."
sequenceDiagram
    participant Client
    participant Vendor
    participant Bank
    Client->>Vendor: Fixed-Price Contract ($250K for NEPSE platform)
    Vendor->>Bank: Loan Application (Collateral: IP Rights)
    Bank-->>Vendor: Approval ($200K, 10% interest)
    Vendor->>Client: Milestone 1 (Login System)
    Client->>Vendor: Payment ($50K)
    Vendor->>Vendor: EVM Check (EV=$45K, AC=$60K → CV=-$15K)
    Vendor->>Client: Escalation (Delay Risk)
    Client->>Vendor: Approve Contingency Fund ($20K)
In the real world
- eSewa uses COCOMO II with
RELY=1.2(high reliability) andTIME=1.0(no strict deadline) to estimate payment gateway development costs, adjusting for Nepal’s regulatory compliance needs (hidden cost: 15% contingency). - Khalti applies Earned Value Management (EVM) to track loan disbursement system progress, where a CPI < 1 (e.g., 0.71 in Pathao’s example) triggered reallocation of developers to backend services to meet the 2-year execution deadline (
TIMEmultiplier). - Ncell’s app budgeting allocates 60% to salaries (reflecting Nepal’s high developer rates) and 20% to AWS tools, using bottom-up budgeting to align with COCOMO II’s
ACAP=0.85(experienced team) multiplier.
Based on the TU BIT syllabus for Software Project Management (BIT402), unit 4.
Discussion
Loading…