Software Project ManagementUnit 39 min read
Resource Estimation, Allocation & Tools in Software Projects
Unit 3 of Software Project Management covers how to estimate human effort, allocate resources efficiently, and use tools like COCOMO II, PERT, and resource histograms to avoid delays and budget overruns in software projects.
Core Concepts
1. What is Resource Management?
Resource management in software projects refers to planning, scheduling, and controlling the allocation of:
- Human resources (developers, testers, PMs)
- Hardware/software tools (servers, IDEs, licenses)
- Financial resources (budgets for salaries, hardware)
Why is it critical?
- Prevents overloading (burnout) or underutilization (wasted costs).
- Ensures timely delivery without compromising quality.
- Balances cost vs. performance trade-offs.
2. Effort Estimation: Why It Matters
Effort estimation predicts how much work (in person-hours) is needed to complete a project. Poor estimates lead to:
- Budget overruns (e.g., a Nepalese fintech app like Khalti exceeding its $500K budget).
- Missed deadlines (e.g., eSewa’s delayed tax payment system in 2022).
- Low morale (teams working overtime without extra pay).
Key Inputs for Estimation:
| Factor | Example in Nepalese Context |
|---|---|
| Project scope | Developing a Daraz mobile app feature. |
| Team expertise | Junior vs. senior developers at F1Soft. |
| Tools/tech stack | Using React Native vs. Flutter for UI. |
| Risks | Cybersecurity threats for Nepal Rastra Bank apps. |
In the Real World
Khalti’s Resource Allocation
- Problem: During Diwali 2023, Khalti’s transaction volume spiked to 500,000/day, requiring 2x more servers than usual.
- Solution: Used cloud auto-scaling (AWS) to dynamically allocate resources, avoiding crashes.
- Lesson: Static resource allocation fails under unpredictable loads.
Pathao’s Driver Scheduling
- Problem: During Dashain, demand surged by 300%, but drivers were underutilized in rural areas.
- Solution: Used resource histograms to redistribute drivers based on real-time demand data.
- Lesson: Resource histograms help visualize peak vs. off-peak needs.
NTC’s Fiber Optic Network Expansion
- Problem: Estimating 10,000 km of fiber installation across Nepal required precise cost/effort models.
- Solution: Used COCOMO II to estimate labor hours and material costs.
- Lesson: COCOMO II adjusts for post-architecture risks (e.g., terrain in mountainous regions).
3. Effort Estimation Models
A. COCOMO II (Constructive Cost Model)
What it does: Predicts effort (in person-months) based on project size (lines of code) and effort multipliers.
Formula:
Effort (PM) = a × (KLOC)^b × ∏EM_i
- KLOC = Thousands of Lines of Code
- EM_i = Effort Multipliers (e.g., Product Attributes, Platform Factors, Personnel Factors)
Post-Architecture Effort Multipliers (Key for Exams!)
| Category | Multiplier Range | Example in Nepalese Projects |
|---|---|---|
| Product Attributes | 0.78–1.30 | Complex algorithms in NEPSE trading apps. |
| Platform Factors | 0.87–1.15 | Legacy systems in NTC’s old billing software. |
| Personnel Factors | 0.82–1.29 | High turnover at startup teams. |
Worked Example: Estimating a Bank Loan App
- Scope: Mobile app for Nabil Bank with 50K LOC.
- Multipliers Applied:
- Product Complexity (High): EM = 1.15
- Platform (Cloud): EM = 1.00
- Team Experience (Medium): EM = 0.95
- Calculation:
Effort = 3.0 × (50)^1.12 × 1.15 × 1.00 × 0.95 ≈ **220 person-months** - Real-World Tie: If Nabil Bank had 10 developers, the project would take ~22 months (vs. their 18-month deadline).
B. PERT (Program Evaluation and Review Technique)
What it does: Estimates time (not just effort) using optimistic (O), pessimistic (P), and most likely (M) estimates.
Formula:
Expected Time (T) = (O + 4M + P) / 6
Example: Developing a Daraz Order Queue System
| Task | Optimistic (O) | Most Likable (M) | Pessimistic (P) | Expected Time (T) |
|---|---|---|---|---|
| Database Design | 2 weeks | 3 weeks | 6 weeks | 3.3 weeks |
| API Development | 4 weeks | 5 weeks | 8 weeks | 5.2 weeks |
| Load Testing | 1 week | 2 weeks | 3 weeks | 1.8 weeks |
Total Project Time: ~10.3 weeks (vs. Daraz’s 12-week target).
4. Resource Allocation Techniques
A. Resource Histogram Equalization
What it does: Balances resource demand vs. availability over time to avoid bottlenecks.
How it works:
- Plot resource demand (e.g., developers needed per week).
- Compare against available resources (e.g., 10 developers).
- Smooth out peaks by:
- Hiring temporaries (e.g., freelancers for Pathao’s peak hours).
- Delaying non-critical tasks.
Example: NTC’s Network Upgrade
(Imagine a bar chart with:
- X-axis: Weeks 1–20
- Y-axis: Number of engineers needed (0–50)
- Red bars: Actual demand (peaks at Week 8: 45 engineers)
- Blue line: Available engineers (max 30)
- Solution: Hire 15 contractors for Weeks 6–10.)*
Why it’s used:
- Prevents overtime (costly for companies like F1Soft).
- Avoids project delays (e.g., eSewa’s 2021 tax filing system crash).
B. Critical Chain Project Management (CCPM)
Key Idea:
- Buffer time is added only to the critical path (not all tasks).
- Reduces multitasking (a major cause of inefficiency).
Example: Kathmandu Traffic Management System
- Critical Path: Sensor installation (6 weeks) → Data processing (4 weeks).
- Non-critical: UI design (can be delayed if sensors are on time).
- Buffer: Add 2 weeks to the critical path to account for monsoon delays.
5. Tools for Resource Management
| Tool | Purpose | Example Use Case |
|---|---|---|
| Microsoft Project | Gantt charts, resource allocation | Nepal Rastra Bank’s core banking system. |
| Jira + Xero | Team tracking + financials | F1Soft’s agile teams. |
| COCOMO II Calculator | Effort estimation | NTC’s fiber expansion bids. |
| ResourceGuru | Real-time workload balancing | Pathao’s driver scheduling. |
6. Common Pitfalls & How to Avoid Them
| Pitfall | Example | Solution |
|---|---|---|
| Overestimating team skills | Assuming juniors can do senior work | Use COCOMO II’s personnel multipliers. |
| Ignoring dependencies | Database team starts after UI | Use PERT to map task sequences. |
| No contingency buffer | Rain delays NTC’s fiber work | Add 10–20% buffer to critical tasks. |
| Static resource allocation | Fixed 10 servers for Khalti | Use cloud auto-scaling. |
Exam Tip
COCOMO II is a must-know:
- Memorize post-architecture multipliers (especially product attributes).
- Worked examples (like the Nabil Bank app) get full marks.
Resource histograms:
- Exams often ask how to balance peaks. Draw a demand vs. availability chart and explain solutions (hiring, delays).
PERT vs. COCOMO:
- PERT = Time estimation.
- COCOMO = Effort (person-hours) estimation.
- Both are tested—link them to real projects (e.g., eSewa, Daraz).
Short-notes questions:
- For Scrum, mention resource flexibility (teams self-organize).
- For resource scheduling, explain Gantt charts vs. histograms.
Case study approach:
- If given a scenario (e.g., "NTC needs to upgrade 500 towers"), structure your answer as:
- Estimate effort (COCOMO II).
- Allocate resources (histogram).
- Identify risks (weather, permits).
- Mitigation (buffers, contractors).
- If given a scenario (e.g., "NTC needs to upgrade 500 towers"), structure your answer as:
Key Formulas to Remember
| Concept | Formula | When to Use |
|---|---|---|
| COCOMO II Effort | E = a × (KLOC)^b × ∏EM_i |
Software projects (e.g., Khalti). |
| PERT Time | T = (O + 4M + P) / 6 |
Task scheduling (e.g., Daraz API). |
| Resource Utilization | (Actual Hours / Planned Hours) × 100 |
Monitoring (e.g., F1Soft teams). |
Visual Summary: Resource Management Lifecycle
flowchart TD
    A["1. Define Scope\n(e.g., Khalti’s new feature)"] --> B["2. Estimate Effort\n(COCOMO II, PERT)"]
    B --> C["3. Allocate Resources\n(Histograms, Gantt charts)"]
    C --> D["4. Monitor & Adjust\n(Jira, Xero)"]
    D --> E["5. Deliver & Retrospect\n(Lessons for next project)"]
    E -->|"Loop"| A
Real Hardware: Server Rack (Cloud Resource Allocation)
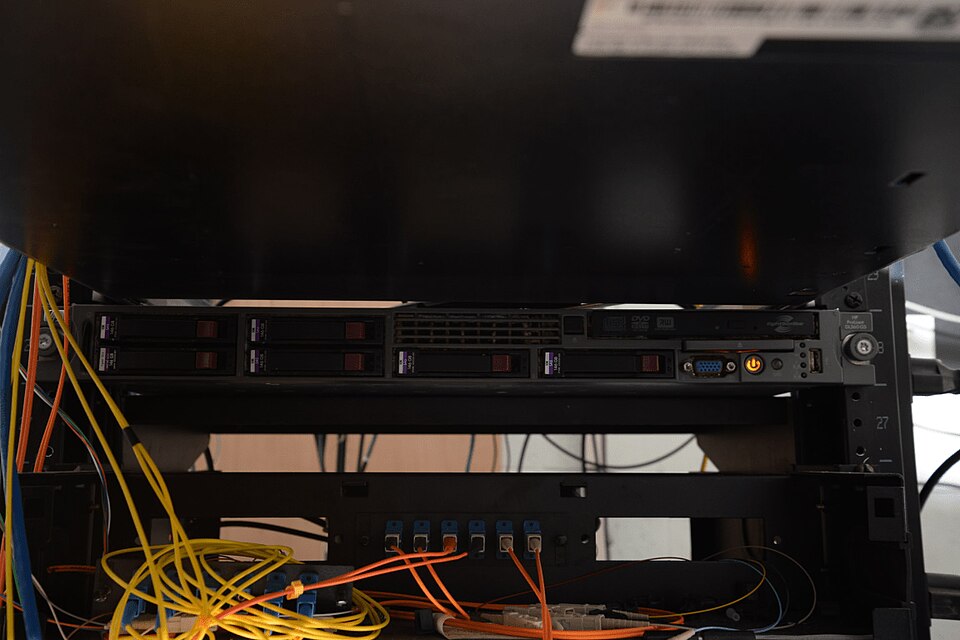
(Shows racks of servers with labels like:
- CPU/GPU nodes (for AI in Nepal Rastra Bank apps).
- Storage arrays (for Daraz’s product databases).
- Network switches (routing Pathao’s real-time traffic).)
Based on the TU BIT syllabus for Software Project Management (BIT402), unit 3.
Discussion
Loading…