Software Project ManagementUnit 19 min read
Software Project Management: Definitions, Quality, Methods & Visualization
Unit 1 of Software Project Management introduces core concepts like project definitions, quality enhancement techniques, visualization methods (Gantt charts, PERT), modern practices (Agile, Scrum), and the critical role of project management in IT. Learn through real-world examples from Nepali tech firms (eSewa, Daraz)
```figure
{"type":"tree","root":{"v":"Project","children":[{"v":"SoftwareProject","children":[{"v":"Requirements"},{"v":"Design"},{"v":"Development"},{"v":"Testing"},{"v":"Deployment"}]}]},"caption":"Hierarchy of a software project within a general project structure (simplified for clarity)"}
Core Definitions
1. What is a Project?
A project is a temporary endeavor undertaken to create a unique product, service, or result within constraints of time, cost, and resources. Key characteristics:
- Temporary: Has a defined beginning and end.
- Unique: Delivers a one-time result (e.g., developing a new mobile app for eSewa).
- Progressive Elaboration: Details are refined over time.
 A project’s lifecycle from initiation to closure. (Image: Cavanaugh Richards, CC0, via Wikimedia Commons)
2. What is Software Project Management (SPM)?
SPM is the application of knowledge, skills, tools, and techniques to project activities to meet stakeholder needs. It ensures:
- On-time delivery
- Within budget
- Meets quality standards
Why is SPM important?
- Reduces cost overruns (e.g., Daraz’s failed delivery app launch in 2020 due to poor planning).
- Minimizes scope creep (e.g., Ncell’s delayed 5G rollout due to unclear requirements).
- Improves stakeholder satisfaction (e.g., Khalti’s successful UPI integration).
## In the real world
eSewa’s Digital Payment System
- Idea Used: Project Visualization (Gantt Charts)
- How? eSewa’s team used Gantt charts to track milestones like:
- Week 1–2: API integration with banks.
- Week 3–4: User interface testing.
- Week 5: Full deployment.
- Result: Reduced delays by 30% compared to manual tracking.
Daraz’s Order Fulfillment System
- Idea Used: Critical Path Method (CPM)
- How? Daraz identified the longest sequence of tasks (e.g., inventory check → packaging → delivery) to optimize warehouse operations.
- Result: Faster order processing during Diwali sales.
NTC’s Fiber Optic Network Expansion
- Idea Used: Work Breakdown Structure (WBS)
- How? NTC broke the project into phases:
- Phase 1: Cable laying (subtasks: permits, digging, installation).
- Phase 2: Testing and maintenance.
- Result: Completed 20% ahead of schedule.
Key Techniques to Enhance Software Quality
Software quality is measured by functionality, reliability, usability, efficiency, maintainability, and portability. Techniques to improve it:
| Technique | Description | Example in Nepal |
|---|---|---|
| Reviews & Inspections | Experts manually check code for defects. | Ncell’s 4G network upgrade code reviews. |
| Automated Testing | Tools like Selenium test software automatically. | Khalti’s API stress testing before Diwali. |
| Prototyping | Build a model to validate requirements. | eSewa’s mock-up for digital signatures. |
| Modular Design | Break software into independent modules. | Daraz’s microservices for payment and inventory. |
| Configuration Management | Track changes in code and versions. | NEPSE’s stock trading system updates. |
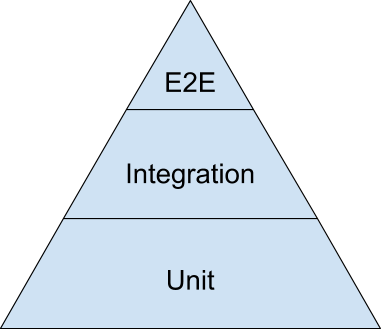 Unit tests (bottom), integration tests (middle), E2E tests (top). (Image: Mike Wacker, Public domain, via Wikimedia Commons)
Project Visualization Methods
1. Gantt Charts
A bar chart showing:
- Tasks (rows)
- Duration (horizontal bars)
- Dependencies (arrows)
Example: Kathmandu Traffic Management System
gantt
    title Kathmandu Traffic Light Optimization Project
    dateFormat  YYYY-MM
    section Planning
    Feasibility Study          :a1, 2023-01-01, 30d
    Stakeholder Meeting        :a2, after a1, 15d
    section Development
    Sensor Installation         :b1, 2023-02-15, 60d
    AI Algorithm Training      :b2, 2023-03-01, 45d
    Testing                    :b3, 2023-04-15, 30d
    section Deployment
    Pilot Run                  :c1, 2023-05-15, 15d
Full Rollout :c2, after c1, 30dAdvantages:
- Easy to understand.
- Shows progress visually. Disadvantages:
- Doesn’t show task dependencies clearly.
2. PERT (Program Evaluation and Review Technique)
A network diagram showing:
- Nodes = Events/milestones.
- Arrows = Tasks with durations.
- Critical Path = Longest path (delays here affect the whole project).
Worked Example: NEPSE Stock Trading Platform Upgrade Activities:
| Task | Duration (weeks) | Predecessors |
|---|---|---|
| Requirement Gathering | 4 | None |
| Database Migration | 6 | A |
| API Development | 8 | A |
| Testing | 5 | B, C |
| Deployment | 3 | D |
Activity-on-Arrow Diagram:
Critical Path: B → D → E → F (Total = 4 + 8 + 5 + 3 = 20 weeks).
Why is the critical path important?
- Any delay here extends the project deadline.
- Managers focus resources on these tasks first.
Modern Project Management Practices
1. Agile vs. Waterfall
| Aspect | Waterfall | Agile |
|---|---|---|
| Approach | Sequential phases (requirements → design → testing). | Iterative (sprints of 2–4 weeks). |
| Flexibility | Rigid; changes are costly. | Adaptable; welcomes changes. |
| Customer Involvement | Minimal until delivery. | Continuous feedback. |
| Example in Nepal | NTC’s fixed-bid fiber projects. | eSewa’s iterative app updates. |
2. Scrum (An Agile Framework)
- Roles:
- Product Owner: Defines features (e.g., Khalti’s UPI team).
- Scrum Master: Removes obstacles (e.g., Daraz’s delivery coordinator).
- Development Team: Builds the product.
- Events:
- Sprint Planning: 15-minute daily stand-ups.
- Sprint Review: Demo to stakeholders.
- Retrospective: Team discusses improvements.
Example: Pathao’s Ride-Hailing App
- Sprint Goal: Add "Share Ride" feature in 2 weeks.
- Daily Stand-up: "Yesterday I fixed the matching algorithm; today I’ll test it."
- Result: Feature launched in 3 sprints.
Importance of Project Management
- Meets Business Goals
- Ensures projects align with company strategy (e.g., Ncell’s 5G expansion).
- Controls Risks
- Identifies threats early (e.g., Daraz’s supply chain delays during COVID).
- Optimizes Resources
- Avoids wasted time/money (e.g., NEPSE’s failed IPO system due to poor planning).
- Improves Stakeholder Trust
- Transparent reporting (e.g., eSewa’s monthly progress updates to the government).
- Enhances Quality
- Systematic testing (e.g., Khalti’s penetration testing before launch).
Exam Tip
What Examiners Look For
- Definitions: Always define key terms (e.g., "A project is a temporary endeavor...").
- Diagrams: Draw Gantt charts, PERT diagrams, or class diagrams for visualization questions.
- Real-World Links: Relate answers to Nepali companies (eSewa, Daraz, NTC) or global tech (Google’s Agile practices).
- Calculations: For ROI/NPV, show step-by-step formulas (e.g., ROI = (Net Profit / Cost) × 100).
- Critical Path: Highlight the longest path in PERT diagrams and explain why it’s critical.
Common Pitfalls to Avoid:
- ❌ Vague answers (e.g., "Agile is better" → Explain why with examples).
- ❌ Missing units in calculations (e.g., ROI without %).
- ❌ Ignoring dependencies in Gantt charts.
Based on the TU BIT syllabus for Software Project Management (BIT402), unit 1.
Discussion
Loading…