Software Project ManagementUnit 210 min read
Project Planning & Scheduling: Methods, Diagrams, Critical Paths & Tools
Unit 2 of Software Project Management covers project planning fundamentals, scheduling techniques (Gantt charts, PERT, CPM), dependency analysis, resource allocation, and modern tools like MS Project and Trello. Learn how to visualize timelines, calculate critical paths, and apply scheduling in real-world IT projects.
TAKEAWAYS:
- Project planning breaks work into tasks, estimates durations, and defines dependencies to create a roadmap.
- Scheduling methods like Gantt charts (visual timelines) and PERT (probabilistic) help track progress and identify bottlenecks.
- Critical Path Method (CPM) pinpoints the longest task sequence—delaying it delays the entire project.
- Modern tools (Trello, Asana, MS Project) automate scheduling, but manual techniques (AOA diagrams) are still exam staples.
- Real-world tie-ins: E-sewa’s payment processing uses Gantt charts for feature rollouts; Daraz’s order fulfillment relies on CPM for warehouse logistics.
- Exam focus: Draw diagrams (AOA, AON), calculate floats/slacks, and explain trade-offs between methods.
1. What Is Project Planning?
Project planning is the blueprint phase where you:
- Define scope (what’s included/excluded).
- Break work into tasks (work breakdown structure, or WBS).
- Estimate durations (time, cost, resources).
- Identify dependencies (which tasks must finish before others start).
Why it matters: Without planning, projects fail due to missed deadlines, budget overruns, or scope creep (uncontrolled changes). For example, Nepal’s NTC fiber expansion uses planning to avoid delays in rolling out 5G across districts.
2. Key Planning Tools: Visualizing Progress
A. Work Breakdown Structure (WBS)
A hierarchical tree of deliverables. Example for a banking app login feature:
1.0 Login Module
├── 1.1 User Authentication API
├── 1.2 OTP Verification System
├── 1.3 Session Management
└── 1.4 Error Handling
B. Gantt Charts: The Timeline Tool
Shows tasks vs. time, dependencies, and progress. Used by Pathao to schedule driver app updates.
gantt
    title Gantt Chart for Software Project
    dateFormat  YYYY-MM-DD
    section Phase 1: Planning
    Define Scope          :a1, 2023-10-01, 7d
    Create WBS            :after a1, 5d
    section Phase 2: Development
    API Development      :2023-10-13, 14d
    UI/UX Design         :2023-10-13, 14d
    Testing              :2023-10-27, 7d
    section Phase 3: Deployment
    Go-Live               :2023-11-10, 3d
Key features:
- Bars: Task duration.
- Arrows: Dependencies (e.g., "Testing starts only after API Development").
- Milestones: Key deadlines (e.g., "Go-Live").
Exam tip: Always label dependencies in Gantt charts (e.g., "Task B → Task C").
3. Scheduling Methods: PERT vs. CPM
A. Program Evaluation and Review Technique (PERT)
- Probabilistic: Uses optimistic (O), pessimistic (P), and most likely (M) time estimates.
- Formula for expected duration:
- Example: Estimating time to deploy Khalti’s new payment gateway.
Task O (weeks) M (weeks) P (weeks) API Integration 2 3 4 3.0 Load Testing 1 2 3 1.83
B. Critical Path Method (CPM)
- Deterministic: Uses fixed durations.
- Goal: Find the longest path (critical path) that dictates project completion.
- Example: NTC’s fiber optic cable laying project (simplified).
Activity Duration (weeks) Predecessor A 2 — B 3 A C 4 A D 2 B, C
Activity-on-Arrow (AOA) Diagram:
Critical Path: A → C → D (total 9 weeks). Delaying any task here delays the project.
Comparison Table:
| Feature | PERT | CPM |
|---|---|---|
| Time Estimates | Probabilistic (O, M, P) | Fixed (single value) |
| Use Case | Research, uncertain tasks | Construction, IT projects |
| Path Analysis | Multiple possible paths | Single critical path |
| Example | NASA’s Apollo missions | Building a bridge |
4. Dependency Types and Float Time
A. Dependency Types
- Finish-to-Start (FS): Task B starts only after Task A finishes (most common).
- Start-to-Start (SS): Task B starts when Task A starts (e.g., coding and testing overlap).
- Finish-to-Finish (FF): Task B finishes when Task A finishes.
- Start-to-Finish (SF): Rare; Task B finishes when Task A starts.
Example: Daraz’s order fulfillment:
- FS: "Receive order" → "Pack order".
- SS: "Pack order" and "Generate invoice" start together.
B. Float/Slack Time
- Total Float: How much a task can be delayed without affecting the project end date.
- Free Float: How much a task can be delayed without affecting successor tasks.
- Formula:
Where:
- LS = Latest Start, ES = Earliest Start
- LF = Latest Finish, EF = Earliest Finish
Example: In the NTC project above, Task B has:
- ES = 2, EF = 5
- LS = 2, LF = 5
- Total Float = 0 (critical task).
- Task D has ES = 9, EF = 11, LS = 9, LF = 11 → Float = 0 (also critical).
5. Modern Project Management Tools
| Tool | Use Case | Example in Nepal |
|---|---|---|
| MS Project | Enterprise scheduling, CPM/PERT | Ncell’s network upgrades |
| Trello | Kanban boards, task tracking | Startup app development |
| Asana | Team collaboration, timelines | E-sewa’s feature planning |
| Jira | Agile sprint planning | Daraz’s bug fixes |
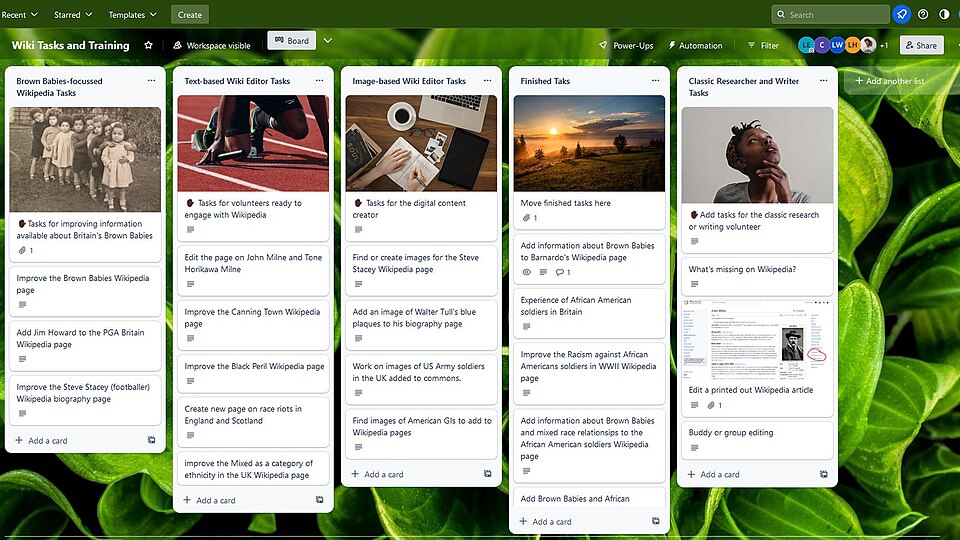 Kanban board for a software sprint (Image: Tenuous tree, CC BY-SA 4.0, via Wikimedia Commons)
6. Real-World Applications
A. E-sewa’s Payment Gateway Rollout
- Tool: Gantt chart in MS Project.
- Critical Path:
- API integration (4 weeks)
- Load testing (2 weeks)
- Bank approval (3 weeks)
- Float: UI design has 2 weeks of slack (can start anytime after API mockups).
B. Kathmandu Traffic Management System
- Problem: Delays in signal synchronization.
- Solution: CPM to identify bottlenecks in traffic light programming.
- Critical Path: "Design algorithm" → "Test in simulation" → "Deploy on-site".
C. NEPSE Stock Trading Platform
- Tool: PERT for uncertain market volatility.
- Example: Estimating time to add a new trading feature:
- Optimistic: 6 weeks
- Most Likely: 8 weeks
- Pessimistic: 12 weeks
- weeks.
7. Exam Tips
- Diagrams are mandatory:
- Draw AOA/AON for CPM questions.
- Label critical paths and floats.
- Formulas to memorize:
- PERT expected time:
- Float: or
- Real-world links:
- Tie Gantt charts to app launches (e.g., Khalti updates).
- Use CPM for infrastructure projects (NTC, roads).
- Short-answer traps:
- "Importance of project planning": Scope control, risk mitigation, stakeholder communication.
- "Gantt chart vs. PERT": Gantt is visual; PERT is probabilistic.
8. Worked Example: Critical Path Calculation
Scenario: A software company is developing a loan approval system for a bank. Activities:
| Activity | Duration (days) | Predecessor |
|---|---|---|
| A: Gather Requirements | 5 | — |
| B: Design Database | 7 | A |
| C: Develop API | 10 | B |
| D: Frontend UI | 8 | B |
| E: Testing | 5 | C, D |
| F: Deployment | 3 | E |
Steps:
- Draw the AOA diagram (as above).
- Calculate earliest start (ES) and earliest finish (EF):
- A: ES=0, EF=5
- B: ES=5, EF=12
- C: ES=12, EF=22
- D: ES=12, EF=20
- E: ES=22, EF=27 (since both C and D must finish)
- F: ES=27, EF=30
- Critical Path: A → B → C → E → F (total 30 days).
- Any delay here delays the project.
9. Common Mistakes to Avoid
- Ignoring dependencies: Assuming tasks are independent when they’re not (e.g., testing can’t start before coding).
- Over-optimistic estimates: Underestimating time leads to scope creep (e.g., Pathao’s delayed feature launches).
- Not updating schedules: Static Gantt charts become useless if progress isn’t tracked.
- Mixing PERT and CPM: Use PERT for uncertain tasks (e.g., research), CPM for fixed tasks (e.g., coding sprints).
10. Summary Checklist
Before submitting an exam answer, ensure you’ve covered: ✅ Definitions: Scope, WBS, Gantt, PERT, CPM. ✅ Diagrams: AOA/AON, Gantt chart (with dependencies). ✅ Calculations: Critical path, floats, PERT expected time. ✅ Real-world tie-ins: E-sewa, Daraz, NTC, or banking examples. ✅ Comparison: PERT vs. CPM, Gantt vs. Kanban.
Based on the TU BIT syllabus for Software Project Management (BIT402), unit 2.
Discussion
Loading…