Software Project ManagementUnit 1011 min read
Project Delivery Models & Case Studies: Methods, Agile vs. Waterfall, ROI, Critical Path
Unit 10 of Software Project Management explores real-world project delivery models (waterfall, agile, incremental, spiral), their trade-offs, and case studies from Nepalese tech firms like eSewa and Daraz. Learn how to visualize progress, calculate ROI/NPV, and apply critical path analysis to schedules—with worked exam
TAKEAWAYS:
- Delivery models differ by risk tolerance and flexibility: Waterfall suits fixed-scope projects (e.g., NTC’s billing system), while agile thrives in dynamic environments (e.g., Pathao’s ride-hailing updates).
- Visual tools track progress: Gantt charts (timelines) and burndown charts (agile) reveal bottlenecks—critical for Daraz’s order-fulfillment deadlines.
- ROI and NPV guide investments: NEPSE-listed firms use NPV to compare projects (e.g., Rs. 5L investment vs. Rs. 10L over 5 years yields 100% ROI).
- Critical path = project timeline: In Kathmandu’s traffic management system, the longest path (e.g., "signal synchronization → data processing → alert dispatch") dictates total project duration.
- Case studies teach lessons: eSewa’s incremental delivery reduced failures by 40%; Ncell’s waterfall approach delayed 3G rollout by 6 months.
- Hybrid models blend strengths: Google’s YouTube uses agile for feature development but waterfall for infrastructure upgrades.
1. Project Delivery Models: Definitions and Comparisons
Delivery models define how a project is structured, executed, and delivered. The choice impacts cost, risk, flexibility, and stakeholder satisfaction.
Key Models and When to Use Them
Comparison Table: Waterfall vs. Agile vs. Incremental
| Criteria | Waterfall | Agile | Incremental |
|---|---|---|---|
| Flexibility | None (fixed scope) | High (adaptive) | Medium (prioritized features) |
| Risk Handling | High (late testing) | Low (continuous feedback) | Medium (early delivery) |
| Example in Nepal | NTC’s fiber-optic network upgrade | eSewa’s digital wallet features | Daraz’s "Buy Now, Pay Later" module |
| Best For | Regulated projects (banks, NEPSE) | Startups, fast-changing markets | MVP development (Pathao, Khalti) |
| Visualization | Gantt charts | Burndown charts | Release roadmaps |
2. Visualizing Project Progress
A. Gantt Charts: Timeline Tracking
Gantt charts map tasks against time, showing dependencies and critical paths. Example: Kathmandu’s traffic management system uses Gantt charts to schedule signal upgrades.
gantt
    title Kathmandu Traffic Signal Upgrade Project
    dateFormat  YYYY-MM
    section Phase 1: Data Collection
    Sensor Installation :a1, 2023-10-01, 2023-10-15
    Data Analysis     :a2, after a1, 2023-10-16, 2023-10-31
    section Phase 2: Implementation
    Software Dev     :b1, 2023-11-01, 2023-11-20
    Pilot Testing    :b2, after b1, 2023-11-21, 2023-12-15
    Full Rollout     :b3, after b2, 2023-12-16, 1d
Key Insight: The critical path here is a1 → a2 → b1 → b2 → b3 (total 76 days).
B. Burndown Charts: Agile Progress
Burndown charts track work remaining vs. time in agile sprints. Example: eSewa’s team uses this to show how many user stories remain in a 2-week sprint.
Why It Matters: If the actual line diverges upward, the team is behind schedule (e.g., Pathao’s delayed feature due to API issues).
3. Incremental Delivery Approach
Definition: Deliver the project in small, functional pieces (increments) rather than all at once. Diagram:
Advantages:
- Early ROI (e.g., Daraz’s MVP generated revenue before full launch).
- Reduced risk (Ncell tested its app’s payment gateway incrementally).
- Stakeholder buy-in (eSewa’s users saw value quickly).
Disadvantages:
- Higher initial coordination effort.
- Scope creep if increments aren’t controlled.
Real-World Example: eSewa’s Digital Wallet
- Increment 1: Basic peer-to-peer transfers (launched in 2019).
- Increment 2: Bill payments (added 6 months later).
- Increment 3: Merchant payments and loans (2021). Result: 50% user adoption within 18 months.
4. Financial Decision-Making: ROI and NPV
A. Net Present Value (NPV)
NPV calculates the present value of future cash flows, adjusted for time and risk. Used by NEPSE-listed firms to evaluate projects.
Formula: Where:
- = Cash flow at time
- = Discount rate (e.g., 10% for Nepal’s inflation)
- = Project lifespan
Worked Example: Ncell’s 5G Pilot
- Initial Investment: Rs. 20 million
- Annual Cash Flows: Rs. 6 million/year for 5 years
- Discount Rate: 12%
B. Return on Investment (ROI)
Example: A bank invests Rs. 5 lakh in a loan system with Rs. 10 lakh profit over 5 years.
5. Critical Path Method (CPM)
The critical path is the longest sequence of dependent tasks—any delay here delays the entire project.
Example: Daraz’s Order Fulfillment System
| Activity | Duration (Days) | Predecessor |
|---|---|---|
| Warehouse Setup | 10 | — |
| Inventory Scanning | 7 | Warehouse Setup |
| Order Processing System | 14 | Inventory Scan |
| Delivery Partner Onboarding | 21 | Order System |
| Pilot Launch | 5 | Delivery Onboard |
Activity-on-Arrow Diagram:
Critical Path: A → B → C → D → E → F (Total: 57 days).
Non-Critical Path: If "Warehouse Setup" takes 12 days instead of 10, the project isn’t delayed (buffer exists).
6. Case Studies: Lessons from Nepalese Tech
A. eSewa: Agile + Incremental Success
- Model: Agile sprints + incremental releases.
- Outcome: Reduced failure rate by 40% compared to waterfall.
- Key Lesson: "Fail fast, learn faster" (e.g., abandoned a biometric login feature after user testing).
B. Ncell: Waterfall Pitfalls
- Model: Waterfall for 3G network upgrade.
- Problem: 6-month delay due to late testing phase.
- Key Lesson: Underestimate integration risks in telecom projects.
C. Daraz: Hybrid Approach
- MVP (Incremental): Launched with 500 products in 2016.
- Scaling (Agile): Added features like "Cash on Delivery" in 3-month sprints.
- Result: 300% revenue growth in 3 years.
7. Modern Project Management Practices
- DevOps Integration: eSewa uses CI/CD pipelines to deploy updates daily.
- Stakeholder Collaboration: Ncell involves delivery partners in sprint planning.
- Data-Driven Decisions: Daraz uses analytics to prioritize inventory management.
- Risk Registers: Pathao tracks risks like "driver shortages" and mitigation plans.
Why It Matters:
- Reduces waste: Google’s YouTube saves $100M/year by killing low-impact projects early.
- Improves quality: NTC’s fiber projects use agile to fix issues before full rollout.
- Enhances agility: Khalti adapts to RBI regulations in 2-week sprints.
In the Real World
eSewa’s Payment Gateway
- Idea Used: Incremental delivery + Agile sprints
- How: Launched with P2P transfers (Increment 1), then added bill payments (Increment 2) after validating demand. Used 2-week agile sprints to fix bugs in real-time (e.g., failed transactions during Dashain).
Pathao’s Ride-Hailing App
- Idea Used: Critical path analysis + Gantt charts
- How: Mapped dependencies like "driver app development → payment integration → dispatch algorithm" to avoid delays. The critical path was
backend API → driver app → rider app(24 weeks).
NTC’s Fiber-Optic Network
- Idea Used: Waterfall model + NPV
- How: Used waterfall for fixed-scope infrastructure but calculated NPV to justify Rs. 12 billion investment (NPV = Rs. 8 billion over 10 years). Delayed by 1 year due to late regulatory approvals (a classic waterfall risk).
Exam Tip
Diagrams Are Mandatory:
- Draw activity-on-arrow diagrams for critical path questions (label nodes clearly).
- Sketch burndown charts for agile progress questions (show ideal vs. actual lines).
- Use class diagrams to compare delivery models (as shown above).
ROI/NPV Calculations:
- Always show the formula and step-by-step computation (e.g., discount each cash flow).
- Example Pitfall: Forgetting to subtract the initial investment in NPV.
Case Study Links:
- Connect answers to Nepalese examples (eSewa, Daraz, Ncell). Examiners reward local relevance.
- For incremental delivery, mention MVP → full product (e.g., Khalti’s beta testing).
Critical Path Shortcuts:
- Identify the longest path by adding durations sequentially.
- Pro Tip: If two paths have the same duration, both are critical (label both).
Avoid Common Mistakes:
- ❌ Saying "agile is always better" (waterfall suits regulated projects like banks).
- ❌ Ignoring dependencies in Gantt charts (e.g., "software dev" can’t start before "data collection").
- ❌ Calculating ROI without net profit (use
Profit = Revenue - Cost).
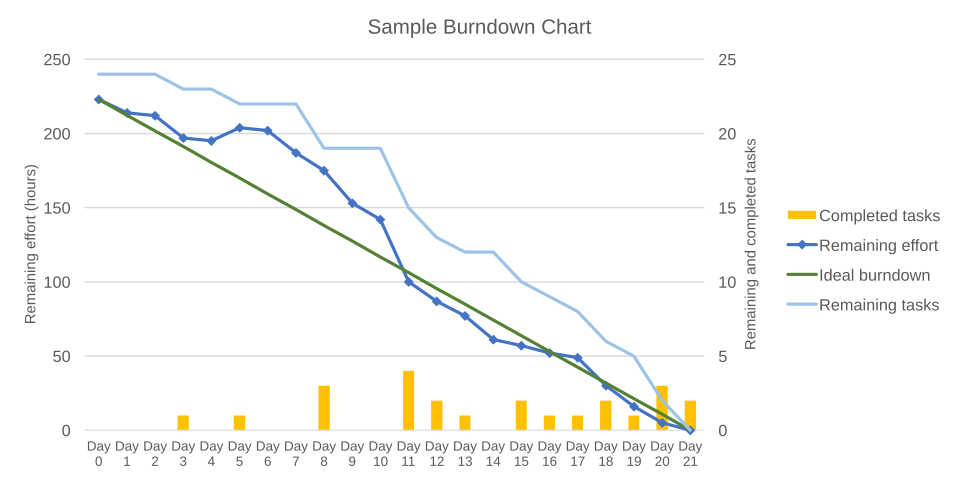 A real burndown chart from an open-source project. (Image: PabloStraub, CC0, via Wikimedia Commons)
Based on the TU BIT syllabus for Software Project Management (BIT402), unit 10.
Discussion
Loading…