Economics for BusinessUnit 612 min read
Perfect Competition vs. Monopoly: Market Power, Efficiency & Real-World Impact
Unit 6 of Economics for Business explores the two extreme market structures—perfect competition and monopoly—covering their definitions, price/output decisions, efficiency implications, and real-world examples from Nepal (NTC, NEPSE) and global firms (Google, WhatsApp). Includes visual comparisons, profit maximization
TAKEAWAYS:
- Perfect competition has price takers with zero market power, while monopolies are price setters with barriers to entry.
- A monopoly’s profit-maximizing output is where MR = MC, but its price is higher than MC, creating deadweight loss.
- Natural monopolies (e.g., NTC’s electricity grid) arise from economies of scale, but regulation (e.g., price caps) prevents abuse.
- Perfect competition is allocatively and productively efficient, while monopolies are inefficient but may invest more in R&D.
- Real-world examples: Google’s search monopoly (network effects), NTC’s regulated monopoly (infrastructure costs), and Daraz’s competitive e-commerce (low barriers).
- Exam focus: Compare price, output, profit, efficiency, and welfare effects using graphs and numerical examples.
1. Perfect Competition: The Idealized Market
Perfect competition is a theoretical market structure where:
- Many small firms sell identical products (homogeneous).
- No barriers to entry/exit (firms can enter or leave freely).
- Perfect information: Buyers and sellers know all prices and qualities.
- Price takers: Individual firms cannot influence market price (they take the price as given).
Key Features Visualized
How Firms Make Decisions
In perfect competition:
- Price (P) = Marginal Revenue (MR) = Average Revenue (AR): Firms sell as much as they want at the market price.
- Profit maximization: Produce where MC = MR (which equals P).
- Short-run shutdown rule: If P < AVC, shut down immediately (cannot cover variable costs).
- Long-run equilibrium: P = MC = AR = AC (minimum) → Zero economic profit (only normal profit).
Worked Example: Wheat Farmers in Nepal
Assume 1,000 identical wheat farmers in Nepal’s Terai region. Market price = Rs. 25/kg.
- Farm A’s cost data:
Output (kg) TC (Rs.) MC (Rs./kg) ATC (Rs./kg) 10 200 20 20 20 350 25 17.5 30 500 30 16.67 40 700 40 17.5
Decision:
- MC = MR = P = Rs. 25 at 20 kg.
- Profit = (P – ATC) × Q = (25 – 17.5) × 20 = Rs. 150.
- Long-run: If profits exist, new farmers enter → price falls to minimum ATC (Rs. 16.67) → zero economic profit.
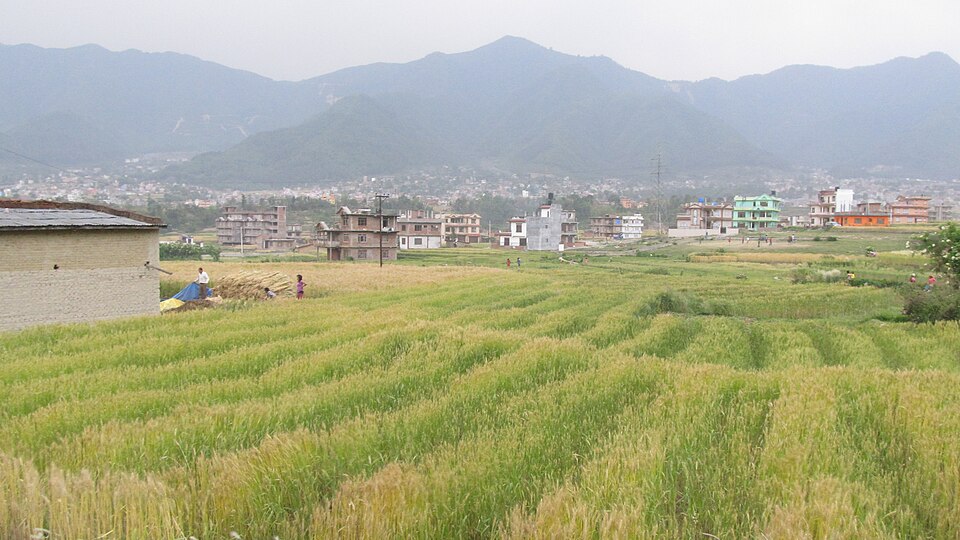 Terai wheat farms operate under near-perfect competition due to homogeneous output and low barriers. (Image: Nirmal Raj Joshi, CC BY-SA 3.0, via Wikimedia Commons)
Efficiency in Perfect Competition
Perfect competition achieves:
- Allocative efficiency: P = MC → Resources go to highest-valued uses.
- Productive efficiency: P = minimum AC → Firms produce at lowest possible cost.
- Dynamic efficiency: Innovation and competition drive progress.
Graph: Perfect Competition Equilibrium
2. Monopoly: The Single-Seller Market
A monopoly exists when:
- One firm is the sole seller of a unique product (no close substitutes).
- High barriers to entry: Legal (patents), natural (economies of scale), or strategic (predatory pricing).
- Price maker: The firm sets the price by choosing output.
Types of Monopolies
classDiagram
    class Monopoly {
        +Single seller
        +Unique product
        +High barriers
        +Price maker
    }
    class NaturalMonopoly {
        +Arises from economies of scale
        +Example: Electricity (NTC), Water supply
    }
    class LegalMonopoly {
        +Government-granted (patents, licenses)
        +Example: NEPSE (stock exchange), Google (search)
    }
    class GeographicMonopoly {
        +Local monopoly due to location
        +Example: Single cinema in a village
    }
    Monopoly <|-- NaturalMonopoly
    Monopoly <|-- LegalMonopoly
    Monopoly <|-- GeographicMonopoly
Profit Maximization in Monopoly
Monopolists maximize profit where:
- MR = MC (but P > MR because demand slopes downward).
- Price is read from the demand curve at the chosen output.
Worked Example: NTC’s Electricity Monopoly NTC is Nepal’s sole electricity provider with natural monopoly characteristics. Assume:
- Demand:
- MC: Constant at Rs. 10 (short run).
- MR:
Steps:
- Set MR = MC: → units.
- Find price from demand: .
- Profit = (P – MC) × Q = (30 – 10) × 40 = Rs. 800.
Graph: Monopoly Profit Maximization
Monopoly vs. Perfect Competition: Key Differences
| Feature | Perfect Competition | Monopoly |
|---|---|---|
| Number of Firms | Many | One |
| Product | Homogeneous | Unique |
| Price Control | Price taker (P = MR) | Price maker (P > MR) |
| Output Decision | MC = P | MC = MR |
| Profit in SR/LR | Zero in LR | Positive in both |
| Efficiency | Allocatively & productively efficient | Inefficient (DWL) |
| Non-price Competition | None (only price) | Advertising, product differentiation |
3. Welfare Effects and Deadweight Loss
Monopolies reduce total surplus (consumer + producer) by:
- Restricting output below competitive level.
- Charging higher prices (consumers pay more, produce less).
Deadweight Loss (DWL):
- The lost economic efficiency due to monopoly pricing.
- Formula: .
Example Calculation (NTC vs. Competitive Market):
- Competitive equilibrium: , (from demand).
- Monopoly equilibrium: , .
- DWL: .
Graph: Deadweight Loss
4. Regulating Monopolies
Since monopolies exploit market power, governments use:
- Price Regulation:
- Marginal Cost Pricing: → Zero profit but may not cover costs.
- Average Cost Pricing: → Normal profit, but may encourage inefficiency.
- Antitrust Laws: Break up monopolies (e.g., Microsoft in the 1990s).
- Public Ownership: Government runs the monopoly (e.g., NTC in Nepal).
Example: Google’s Search Monopoly
- Barrier: Network effects (more users → more data → better search).
- Regulation: EU fined Google €4.3 billion (2018) for abusing dominance.
- Impact: Forced Google to allow third-party comparison sites.
5. Real-World Applications in Nepal and Globally
In Nepal
NTC (Nepal Electricity Authority)
- Structure: Natural monopoly (high fixed costs for grids).
- Issue: High prices due to inefficiency and lack of competition.
- Regulation: Government sets tariffs to balance affordability and sustainability.
NEPSE (Nepal Stock Exchange)
- Structure: Legal monopoly (sole stock exchange in Nepal).
- Role: Facilitates trading but faces criticism for high transaction fees.
Daraz (Alibaba’s Nepal unit)
- Structure: Monopolistic competition (many sellers, differentiated products).
- Example: Sellers offer unique products (e.g., handmade Thangka paintings) but compete on price and reviews.
Global Examples
Google Search
- Monopoly power: 90%+ market share in search.
- Barrier: Network effects (users stick to Google for convenience).
- Regulation: EU and US antitrust cases over data misuse.
WhatsApp (Meta)
- Near-monopoly: Dominates messaging in Nepal (80%+ usage).
- Barrier: First-mover advantage and integration with Facebook.
- Impact: Forces competitors (e.g., iMessage) to adapt.
Ncell (Nepal Telecom)
- Oligopoly: Dominates with Ncell and NTC, but faces competition from Smart Cell.
- Pricing: Uses price wars and bundled offers to retain customers.
6. Comparing Market Structures: A Summary Table
| Feature | Perfect Competition | Monopoly | Monopolistic Competition | Oligopoly |
|---|---|---|---|---|
| Number of Firms | Many | One | Many (differentiated) | Few |
| Product | Homogeneous | Unique | Differentiated | Homogeneous or differentiated |
| Price Control | None (P = MR) | High (P > MR) | Some (P > MR) | Some (tactical pricing) |
| Barriers | None | High | Low to moderate | High (economies of scale) |
| Profit in LR | Zero | Positive | Normal profit | Normal or supernormal |
| Efficiency | Allocative & productive | Inefficient (DWL) | Some inefficiency | Mixed |
| Example (Nepal) | Wheat farmers | NTC, NEPSE | Daraz sellers, local cafés | Ncell, Smart Cell |
Exam Tip: How to Score Full Marks
Graphs Are Mandatory:
- Always draw demand, MR, MC, and AC curves for monopoly/perfect competition questions.
- Label profit areas, equilibrium points, and DWL triangles.
Numerical Examples:
- If given data, always calculate profit, output, and price.
- Example: "A monopolist has MC = 10, demand P = 50 – Q. Find profit-maximizing output and price."
Compare and Contrast:
- Questions often ask: "How does a monopoly differ from perfect competition in terms of efficiency?"
- Use the table above and DWL graphs to structure your answer.
Real-World Links:
- Relate theories to Nepal’s NTC, NEPSE, or Daraz or global firms like Google.
- Example: "Like a monopoly, NTC restricts output to maximize profit, leading to higher electricity prices and deadweight loss."
Common Pitfalls:
- ❌ Assuming monopolies always charge the highest possible price (they maximize profit, not revenue).
- ❌ Ignoring MC in short-run decisions (shutdown if P < AVC).
- ❌ Forgetting long-run adjustments (perfect competition drives zero profit in LR).
Final Checklist for Exam Questions:
- Did I label all curves correctly (P, MR, MC, AC)?
- Did I show profit area and DWL where required?
- Did I compare output, price, and efficiency between structures?
- Did I use real-world examples (NTC, Google, Daraz) to illustrate points?
Based on the TU BITM syllabus for Economics for Business (ECO206), unit 6.
Discussion
Loading…