Economics for BusinessUnit 312 min read
Supply, Demand Shifts, Market Equilibrium & Policy Tools
Unit 3 of Economics for Business explains how supply curves shift, how markets reach equilibrium, and how government policies (taxes, subsidies) affect prices and quantities—with real-world examples from Nepal’s NTC, Daraz, and Ncell.
TAKEAWAYS:
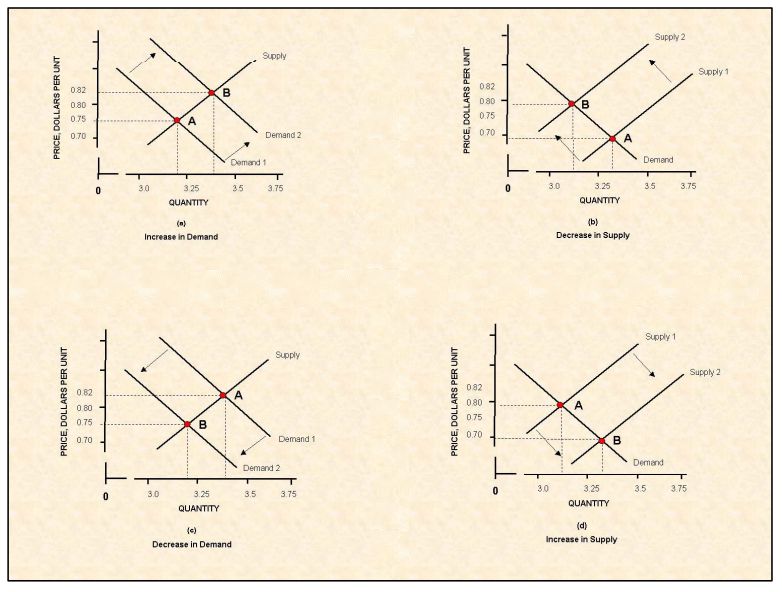
- Supply curves shift due to non-price factors (costs, technology, expectations, subsidies/taxes) and move left (decrease) or right (increase)—never along the curve.
- Market equilibrium occurs where quantity demanded = quantity supplied, and any imbalance creates surpluses (excess supply) or shortages (excess demand).
- Government tools (price ceilings, floors, taxes, subsidies) distort equilibrium but can address market failures like monopolies or externalities.
- Elasticity matters: If supply is inelastic, price changes have little effect on quantity (e.g., NTC’s fuel supply); if elastic, small price changes cause big quantity shifts (e.g., Daraz’s discounts).
- Real-world applications: Ncell’s SIM card shortages (supply < demand), NTC’s fuel price hikes (supply shifts left), and Daraz’s dynamic pricing (supply elasticity).
- Exam focus: Trace shifts on graphs, calculate new equilibria, and explain why policies (e.g., subsidies for solar panels) work or fail.
1. Supply: The Basics
Supply is the quantity of a good/service producers are willing to sell at different prices, holding other factors constant. The law of supply states that, ceteris paribus, as price rises, quantity supplied rises (and vice versa). This relationship is shown by an upward-sloping supply curve.
Why Does Supply Increase with Price?
- Profit incentive: Higher prices mean more revenue per unit, encouraging firms to produce more.
- Opportunity cost: At higher prices, firms can afford to use more expensive inputs (e.g., labor, raw materials).
- New firms enter: If prices are high enough, new producers enter the market (e.g., more Daraz sellers during Diwali).
Non-Price Determinants of Supply
These factors shift the entire supply curve (left = decrease, right = increase):
| Factor | Effect on Supply | Example in Nepal |
|---|---|---|
| Input costs | ↑ Costs → Left shift | NTC raises fuel import costs → less supply |
| Technology | ↑ Tech → Right shift | Daraz uses AI for inventory → more supply |
| Taxes | ↑ Taxes → Left shift | Government taxes on cigarettes → less supply |
| Subsidies | ↑ Subsidies → Right shift | Govt. subsidizes solar panels → more supply |
| Producer expectations | Expect ↑ future prices → Left shift now | Farmers hold back rice if they expect higher prices later |
| Number of sellers | More sellers → Right shift | More mobile network operators (Ncell, NTC) → more supply |
| Natural conditions | Bad weather → Left shift | Drought reduces agricultural supply |
2. Market Equilibrium: Where Supply Meets Demand
Market equilibrium occurs where quantity demanded (Qd) = quantity supplied (Qs). At this point:
- There is no pressure for price to change.
- The market is stable (no surpluses or shortages).
How Equilibrium Works
- Initial equilibrium: Suppose Daraz sells 5000 smartphones at Rs. 2000 each (Qd = Qs = 5000).
- Price > Equilibrium (e.g., Rs. 2500):
- Qd < Qs → Surplus (excess supply) → Sellers lower prices to sell stock.
- Price < Equilibrium (e.g., Rs. 1500):
- Qd > Qs → Shortage (excess demand) → Buyers bid prices up.
 Ncell SIM card shortage (2023): Demand shifts right due to new users, but supply lags → shortage at Rs. 1000 (Image: Lorie A. Wagner, Daniel E. Sullivan, and John L. Sznopek, Public domain, via Wikimedia Commons)
Worked Example: NTC’s Fuel Price Hike
- Initial equilibrium: Fuel price = Rs. 120/L, Q = 5 million liters/day.
- Event: Global oil prices rise → supply shifts left (higher input costs).
- New equilibrium: Price = Rs. 150/L, Q = 4 million liters/day.
- Why?
- At Rs. 120/L, Qs < Qd → shortage → NTC raises prices.
- Higher prices reduce demand slightly, but supply is still constrained.
3. Government Intervention: When Markets Fail
Markets don’t always work perfectly. Governments use tools to correct market failures (e.g., monopolies, externalities) or achieve social goals.
A. Price Ceilings (Maximum Price)
- Definition: A legal maximum price set below equilibrium (e.g., rent control).
- Effect:
- Creates shortages (Qd > Qs).
- Black markets may emerge (e.g., illegal fuel sales in Nepal).
- Example:
- Nepal’s fuel price cap (2022): Govt. set a max price of Rs. 110/L during protests → shortage of 1 million liters/day as suppliers reduced supply.
B. Price Floors (Minimum Price)
- Definition: A legal minimum price set above equilibrium (e.g., minimum wage).
- Effect:
- Creates surpluses (Qs > Qd).
- Govt. may buy excess (e.g., buffer stocks for food).
- Example:
- Nepal’s agricultural price floors: Govt. guarantees Rs. 150/kg for wheat to support farmers → surplus of 50,000 tons stored in godowns.
C. Taxes (Shift Supply Left)
- Who pays? Both buyers and sellers share the burden, depending on elasticity.
- Example:
- Nepal’s 20% tax on cigarettes: Supply shifts left → price rises from Rs. 200 to Rs. 250 → Q falls from 10 million to 8 million packs/year.
D. Subsidies (Shift Supply Right)
- Who benefits? Consumers (lower prices) and producers (higher profits).
- Example:
- Govt. subsidy for solar panels: Rs. 5000 subsidy per panel → supply shifts right → price drops from Rs. 40,000 to Rs. 35,000 → Q rises from 50,000 to 70,000 units/year.
4. Elasticity of Supply: How Responsive is Supply?
Elasticity of supply (Es) measures how much quantity supplied changes in response to a price change:
- Es > 1: Elastic (small price change → big quantity change).
- Es < 1: Inelastic (price change has little effect on quantity).
- Es = 0: Perfectly inelastic (quantity doesn’t change, e.g., NTC’s fuel supply in the short run).
Factors Affecting Elasticity of Supply
| Factor | Effect on Elasticity | Example |
|---|---|---|
| Time period | Longer time → More elastic | Daraz can adjust inventory in months, not days |
| Availability of inputs | More inputs → More elastic | Ncell can quickly add more SIM cards |
| Storage capacity | More storage → More elastic | Agricultural products (rice) are inelastic in short run |
| Production flexibility | Flexible production → More elastic | Tech products (smartphones) vs. land (inelastic) |
Worked Example: Daraz’s Discount Elasticity
- Scenario: Daraz offers a 10% discount on laptops (price drops from Rs. 50,000 to Rs. 45,000).
- Data:
- Initial Qs = 1000 units, new Qs = 1500 units.
- %ΔPrice = -10%, %ΔQs = +50%.
- Calculation:
- Interpretation: Daraz’s supply is highly elastic—small price cuts lead to big increases in quantity supplied (likely due to inventory adjustments).
5. Real-World Applications in Nepal
A. NTC’s Fuel Supply Challenges
- Problem: Nepal imports 90% of its fuel. When global oil prices rise (e.g., 2022), supply shifts left.
- Effect:
- Price rises from Rs. 120/L to Rs. 150/L.
- Shortage of 1.5 million liters/day in Kathmandu.
- Policy Response: Govt. imposed price controls → black market emerged.
B. Daraz’s Dynamic Pricing
- Idea: Daraz adjusts prices based on demand elasticity (e.g., discounts during Diwali).
- How it works:
- High demand (Diwali): Supply curve shifts right (more sellers), but Daraz lowers prices to clear inventory.
- Low demand (monsoon): Prices rise slightly to balance supply.
C. Ncell’s SIM Card Shortages
- Scenario: During COVID-19 (2020), demand for SIM cards surged (new users, replacements).
- Supply Constraint:
- Short-run supply is inelastic (limited production capacity).
- Price rose from Rs. 500 to Rs. 1000, but shortage persisted due to supply lag.
D. Agricultural Price Supports
- Policy: Govt. buys rice at Rs. 150/kg to support farmers.
- Effect:
- Creates a price floor → surplus of 200,000 tons stored in godowns.
- Opportunity cost: Storage and wastage (e.g., rice spoilage in 2021).
6. Exam Tip: How to Score Full Marks
Graphs are mandatory:
- Always draw supply/demand curves with shifts (dashed lines).
- Label equilibrium points (P*, Q*) and new equilibria after shifts.
- Example: If asked about a tax, show supply shifting left and the new equilibrium at higher price, lower quantity.
Explain the "why":
- Don’t just say "supply shifts left"—explain why (e.g., "due to higher input costs from the Russia-Ukraine war").
- Link to real-world examples (e.g., "like NTC’s fuel price hikes in 2022").
Calculate equilibria:
- If given a table of supply/demand, plot the points and find where Qd = Qs.
- Example:
Price (Rs.) Qd Qs 100 60 40 150 50 50 200 40 60 → Equilibrium at P=150, Q=50.
Policy analysis:
- For price ceilings/floors, always show:
- The equilibrium price/quantity.
- The new price/quantity after intervention.
- The surplus/shortage created.
- Example: "A Rs. 100 price ceiling on fuel creates a shortage of 1 million liters/day."
- For price ceilings/floors, always show:
Elasticity questions:
- If asked to compare elasticities, use the midpoint formula and interpret:
- |Es| > 1 → Elastic (e.g., Daraz’s discounts).
- |Es| < 1 → Inelastic (e.g., NTC’s fuel in short run).
- If asked to compare elasticities, use the midpoint formula and interpret:
7. Common Mistakes to Avoid
- Shifting along the curve: Remember, only non-price factors shift supply/demand. Price changes move along the curve.
- Ignoring ceteris paribus: If demand shifts, assume supply stays constant (and vice versa).
- Forgetting secondary effects: A tax not only reduces quantity but also reduces producer revenue (show this in your graph).
- Vague answers: Instead of "supply increases," say "supply shifts right due to improved technology, like Daraz’s AI inventory system."
8. Practice Questions (Exam-Style)
Graphical Analysis:
- Draw the market for Nepalese rice. Show the effect of:
- A drought (supply shift).
- A govt. subsidy (supply shift).
- Label the new equilibrium price and quantity.
- Draw the market for Nepalese rice. Show the effect of:
Numerical Problem:
- Suppose the equilibrium price of a smartphone is Rs. 40,000 with Q=10,000 units.
- If a Rs. 5,000 tax is imposed on sellers, and supply becomes:
- Qs = 2000 + 2P (after tax).
- Find the new equilibrium price and quantity.
Short Answer:
- Why did Ncell face SIM card shortages in 2020? Use supply/demand analysis to explain.
9. Key Formulas to Remember
| Concept | Formula | When to Use |
|---|---|---|
| Price Elasticity of Supply | Compare responsiveness of supply to price changes | |
| Equilibrium Condition | Find market-clearing price/quantity | |
| Tax Burden | Depends on elasticity (steeper curve bears less burden) | Analyze who pays more in a tax scenario |
10. Summary Table: Government Tools
| Tool | Effect on Supply/Demand | Example in Nepal | Consequence |
|---|---|---|---|
| Price Ceiling | Qd > Qs (shortage) | Fuel price cap (2022) | Black market, long queues |
| Price Floor | Qs > Qd (surplus) | Agricultural price supports | Govt. stockpiles, wastage |
| Tax | Supply shifts left | Cigarette tax (20%) | Higher prices, lower quantity |
| Subsidy | Supply shifts right | Solar panel subsidy (Rs. 5000) | Lower prices, higher quantity |
flowchart TD
    A["Initial Equilibrium\n(P=Rs. 120, Q=5M liters)"]
    B["Supply Shock: Oil Prices Rise\n(Supply shifts LEFT)"]
    C["New Equilibrium\n(P=Rs. 150, Q=4M liters)"]
    D["Shortage: Qd > Qs\n(Black market emerges)"]
    A --> B --> C --> D
Based on the TU BITM syllabus for Economics for Business (ECO206), unit 3.
Discussion
Loading…