Business IntelligenceUnit 39 min read
Data Warehousing: Architecture, ETL, OLAP & Business Use
Unit 3 of Business Intelligence explores data warehousing fundamentals—its architecture, ETL processes, OLAP cubes, and real-world applications in decision support. Learn how raw data transforms into actionable insights for businesses like Nabil Bank or Daraz.
What is Data Warehousing?
Data warehousing is a centralized repository that stores integrated, subject-oriented, time-variant, and non-volatile data from multiple sources to support business intelligence (BI) and decision-making. Unlike operational databases (OLTP), which focus on transaction processing, data warehouses optimize query performance and analytical reporting.
Key Characteristics of a Data Warehouse
mindmap
  root((Data Warehouse))
    Characteristics
      Subject-Oriented: Organized by business functions (e.g., sales, finance)
      Integrated: Data from heterogeneous sources (ERP, CRM, Excel) is cleaned and standardized
      Time-Variant: Historical data is stored (e.g., sales trends over 5 years)
      Non-Volatile: Data is never updated or deleted; only new data is added
    Purpose
      Decision Support: Enables strategic analytics (e.g., "Which product drives 30% of revenue?")
      Reporting: Generates KPIs, dashboards, and ad-hoc queries
      Data Mining: Supports predictive modeling (e.g., customer churn analysis)
Data Warehouse Architecture
A typical data warehouse follows a multi-layered architecture:
| Layer | Function | Example in Nepal |
|---|---|---|
| Data Sources | Operational systems (ERP, CRM, POS) | Nabil Bank’s core banking system |
| Staging Area | Raw data is cleaned, transformed, and loaded | Daraz’s order and inventory databases |
| Data Warehouse | Integrated, subject-oriented data (e.g., "Customer," "Sales") | NTC’s network performance analytics |
| Data Mart | Subset of data for specific departments (e.g., Marketing, Finance) | Pathao’s driver performance dashboard |
| OLAP Server | Enables multidimensional analysis (e.g., "Sales by region, product, time") | Khalti’s fraud detection system |
| Front-End Tools | BI tools (Tableau, Power BI) for visualization | NEPSE’s stock market trend analysis |
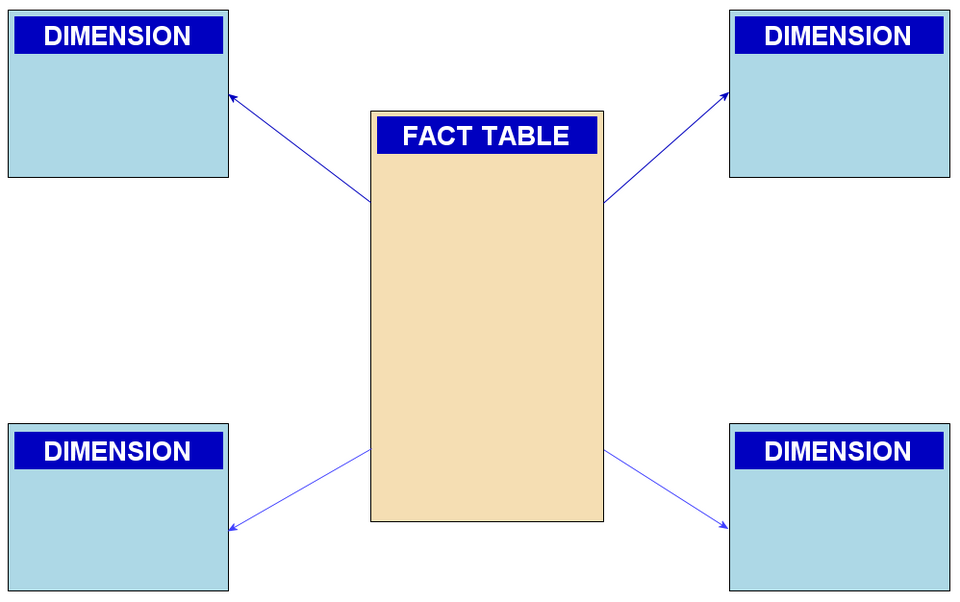 How fact tables (sales) link to dimension tables (product, date, customer) (Image: SqlPac, CC BY-SA 3.0, via Wikimedia Commons)
ETL (Extract, Transform, Load) Process
ETL is the backbone of data warehousing, ensuring data is clean, consistent, and ready for analysis.
flowchart LR
  A["Extract"] --> B["Transform"]
  B --> C["Load"]
  A -->|"From"| D["Source Systems<br/>(ERP, CRM, Excel)"]
  B -->|"Clean, Aggregate,<br/>Standardize"| E["Staging Area"]
  C -->|"Into"| F["Data Warehouse"]
  F -->|"To"| G["OLAP Cubes<br/>Dashboards"]
Worked Example: Nabil Bank’s Loan Default Prediction
- Extract: Pull loan application data (borrower details, credit score, income) from Nabil Bank’s core system.
- Transform:
- Clean missing values (e.g., fill "unknown" income with median income).
- Aggregate monthly transactions into yearly summaries.
- Encode categorical data (e.g., "Urban/Rural" → 1/0).
- Load: Store in a data warehouse with dimensions:
- Fact Table:
Loan_ID,Amount,Default_Status(0/1) - Dimensions:
Customer,Location,Loan_Type,Time
- Fact Table:
OLAP (Online Analytical Processing)
OLAP enables multidimensional analysis of data stored in OLAP cubes. Unlike OLTP (transactional), OLAP supports:
- Slice & Dice: View data by different dimensions (e.g., "Sales in Kathmandu for Q1 2023").
- Drill-Down/Up: Move from summary to detail (e.g., "Why did Q1 sales drop? → Check regional performance").
- Pivoting: Rotate axes (e.g., compare "Sales by Product" vs. "Sales by Region").
OLAP vs. OLTP
| Feature | OLAP (Data Warehouse) | OLTP (Operational DB) |
|---|---|---|
| Purpose | Analytical queries (e.g., "Trend analysis") | Transaction processing (e.g., "Place order") |
| Data Volume | Large, historical, aggregated | Small, current, detailed |
| Query Type | Complex, read-heavy (e.g., "Top 10 customers") | Simple, write-heavy (e.g., "Update stock") |
| Example | NEPSE analyzing stock price trends | Daraz processing real-time orders |
Data Warehouse vs. Database vs. Data Lake
| Component | Data Warehouse | Operational Database (OLTP) | Data Lake |
|---|---|---|---|
| Purpose | BI, reporting, analytics | Transaction processing | Raw data storage (unstructured) |
| Data Structure | Structured, schema-on-write | Structured, normalized | Semi-structured/unstructured (JSON, logs) |
| Update Frequency | Batch-loaded (daily/weekly) | Real-time (milliseconds) | Continuous ingestion |
| Example | NTC analyzing network traffic patterns | Nabil Bank’s ATM transaction logs | Google storing YouTube video metadata |
Real-World Applications in Nepal
1. Nabil Bank’s Customer Segmentation
- Idea Used: Data warehousing + OLAP
- How:
- ETL: Extracts transaction data from core banking → transforms into customer segments (high-value, churn-risk) → loads into a data warehouse.
- OLAP: Analysts "slice" data by
Customer_Segment,Loan_Type, andTimeto identify cross-selling opportunities. - Outcome: Targeted marketing (e.g., "Offer credit cards to high-spend customers").
2. Daraz’s Inventory Optimization
- Idea Used: Data mart + predictive analytics
- How:
- Data Mart: Subset of warehouse data for supply chain team (only
Product_ID,Stock_Level,Sales_Velocity). - OLAP: "Drill down" to see which products in Pokhara have low stock but high demand.
- Outcome: Reduces overstocking by 20% using automated reorder alerts.
- Data Mart: Subset of warehouse data for supply chain team (only
3. NTC’s Network Performance Monitoring
- Idea Used: Real-time data warehousing
- How:
- ETL: Pulls call drop data from cell towers → aggregates by
Tower_ID,Time,Network_Type. - OLAP: Identifies "hotspots" (e.g., "Why is call quality poor in Bhaktapur at 6 PM?").
- Outcome: Deploys additional towers in high-traffic areas.
- ETL: Pulls call drop data from cell towers → aggregates by
Advantages and Disadvantages
Advantages
- Single Source of Truth: Eliminates data silos (e.g., Finance and Marketing using the same customer data).
- Faster Queries: Optimized for analytics (e.g., "Which 5 products contribute to 80% of revenue?").
- Historical Analysis: Tracks trends over years (e.g., "How did COVID-19 impact e-commerce?").
- Decision Support: Enables data-driven strategies (e.g., NEPSE’s algorithmic trading).
Disadvantages
- High Cost: Requires hardware, ETL tools (e.g., Informatica), and skilled personnel.
- Latency: Data is not real-time (batch processing delays).
- Complexity: Designing schemas (star vs. snowflake) and maintaining data quality is challenging.
- Storage Overhead: Historical data consumes significant space.
Case Study: Chaudhary Group’s Supply Chain Analytics
Problem: Chaudhary Group (owners of Himalayan Java, Bhatbhateni) struggled with demand forecasting across 50+ outlets. Solution: Implemented a data warehouse with:
- ETL Pipeline:
- Extracted POS data from all outlets.
- Transformed to standardize units (e.g., "kg" vs. "lbs" for coffee beans).
- Loaded into a star schema with facts:
Sales_Amount,Quantity; dimensions:Product,Store,Date.
- OLAP Analysis:
- Used slice-and-dice to find:
- "Which stores in Kathmandu have 30% higher coffee sales on weekends?"
- "Which products have declining demand in Pokhara?"
- Used slice-and-dice to find:
- Outcome:
- Reduced overstocking by 15% by adjusting orders based on predictive trends.
- Increased revenue by 12% through targeted promotions (e.g., "Buy 1 kg, get 200g free").
Exam Tip
- Define Clearly: Always start with a one-sentence definition of data warehousing (e.g., "A subject-oriented, integrated, time-variant repository...").
- Draw Diagrams: Expect questions on:
- Architecture layers (source → staging → warehouse → mart → OLAP).
- Star vs. snowflake schemas (show how dimensions normalize).
- ETL Example: Be ready to trace data flow (e.g., "How would you load NEPSE stock data into a warehouse?").
- OLAP Operations: Practice slice, dice, drill-down on a sample cube (e.g., "Given a sales cube, how would you find Q1 2023 sales in Kathmandu for product X?").
- Real-World Link: Relate to Nepali companies (e.g., "How would Nabil Bank use a data warehouse for fraud detection?").
- Advantages/Disadvantages: Compare data warehouse vs. database vs. data lake in a table (as above).
- Case Study: Know one Nepali example (e.g., NTC, Nabil Bank, Daraz) and explain its ETL + OLAP process.
Key Formula to Remember: For data warehouse size estimation: Example: If NTC generates 100GB/day and retains 5 years (1825 days) with 40% compression:
Based on the TU BITM syllabus for Business Intelligence (IT249), unit 3.
Discussion
Loading…