Business IntelligenceUnit 210 min read
Decision Making & Decision Support Systems: Models, Types & Tools
Unit 2 of Business Intelligence explores how organizations make data-driven decisions, covering decision-making models (rational, bounded rationality, satisficing), decision support systems (DSS), group decision support systems (GDSS), and their applications in business analytics.
TAKEAWAYS:
- Decision-making ranges from rational (optimal) to bounded rationality (satisficing) to intuitive, with each model suited to different business contexts.
- Decision Support Systems (DSS) combine data, models, and user interaction to improve decision quality, while Group DSS (GDSS) enhance collaboration in team settings.
- Types of DSS (model-driven, data-driven, communication-driven, knowledge-driven) serve distinct business needs, from financial forecasting to strategic planning.
- Real-world examples like Nepal Rastra Bank’s monetary policy decisions (model-driven DSS) or Daraz’s dynamic pricing (data-driven DSS) show how these systems drive efficiency.
- OLAP cubes and what-if analysis are key tools in DSS for exploring business scenarios interactively.
- Exam focus: Be ready to compare DSS types, explain Simon’s decision-making models, and apply DSS concepts to case studies (e.g., NTC’s network optimization).
1. Decision Making: Models and Process
Decisions are the backbone of business strategy. Herbert Simon’s decision-making models classify how humans and organizations make choices under uncertainty.
1.1 Simon’s Decision-Making Models
Simon proposed three models to explain how decisions are made in real-world constraints:
mindmap
  root((Decision-Making Models))
    Rational Model
      "Optimal choice under certainty"
      "All alternatives & outcomes known"
      "Maximizing utility"
    Bounded Rationality
      "Limited information & cognitive ability"
      "Satisficing (good enough) rather than optimizing"
      "Heuristics used for speed"
    Intuitive Model
      "Experience-based, subconscious judgment"
      "Fast, but may lack logical rigor"
      "Used in crises or expert domains"
Key Takeaway:
- Rational Model: Assumes perfect information (theoretical, rarely achievable).
- Bounded Rationality: Most practical for businesses (e.g., a manager choosing a supplier based on partial data).
- Intuitive Model: Used by experts (e.g., a chef adjusting recipes based on taste, not data).
1.2 The Decision-Making Process
A structured approach to decision-making involves:
- Problem Identification: Recognize the issue (e.g., declining sales in a Daraz category).
- Data Collection: Gather relevant data (e.g., customer feedback, market trends).
- Alternative Generation: Brainstorm solutions (e.g., discount offers, new product lines).
- Evaluation: Assess alternatives using criteria (e.g., cost, customer response).
- Selection: Choose the best option (e.g., launch a limited-time discount).
- Implementation: Execute the decision.
- Feedback: Monitor results and adjust (e.g., track sales impact).
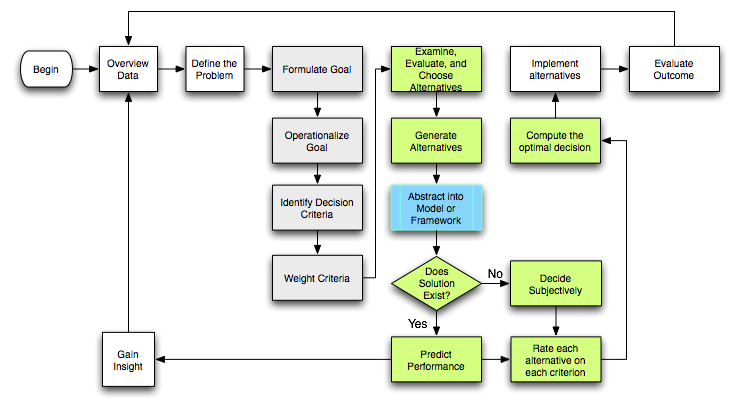 A visual of the 7-step process with arrows connecting each stage. (Image: DavidLevinson, CC BY-SA 3.0, via Wikimedia Commons)
2. Decision Support Systems (DSS)
DSS are interactive computer-based systems that help managers make better decisions by combining data, models, and user input.
2.1 Components of a DSS
A typical DSS consists of:
- Database: Stores raw data (e.g., sales records, customer demographics).
- Model Base: Contains analytical models (e.g., regression, simulation).
- User Interface: Allows interaction (e.g., dashboards, query tools).
- Dialogue System: Manages user-DSS communication (e.g., prompts for inputs).
flowchart TD
  A["User Input"] --> B["Dialogue System"]
  B --> C["Database"]
  B --> D["Model Base"]
  C --> E["Data Analysis"]
  D --> E
  E --> F["Output/Recommendations"]
  F --> A
2.2 Types of DSS
DSS can be classified based on their primary function:
| Type | Description | Example in Nepal |
|---|---|---|
| Model-Driven DSS | Uses mathematical models (e.g., linear programming) to solve problems. | Nepal Rastra Bank’s interest rate modeling for monetary policy. |
| Data-Driven DSS | Relies on historical data for analysis (e.g., sales trends). | Daraz’s dynamic pricing based on demand and inventory. |
| Communication-Driven DSS | Facilitates group decision-making (e.g., video conferencing + data sharing). | Nepal Investment Bank’s loan committee using shared dashboards for approvals. |
| Knowledge-Driven DSS | Uses expert systems or AI to mimic human expertise. | Ncell’s customer churn prediction using machine learning models. |
| Document-Driven DSS | Organizes and retrieves unstructured data (e.g., contracts, emails). | Law firms in Kathmandu using DSS to search past case documents. |
3. Group Decision Support Systems (GDSS)
GDSS are designed to improve collaboration in decision-making by:
- Reducing groupthink (pressure to conform).
- Enhancing anonymous input (prevents bias from dominant personalities).
- Providing structured voting and consensus-building tools.
Real-World Example: Kathmandu Traffic Management The Kathmandu Metropolitan City uses a GDSS to optimize traffic signals. Sensors collect real-time data, and a centralized system adjusts signal timings dynamically. This reduces congestion by 15% in peak hours.
flowchart LR
  A["Traffic Sensors"] --> B["Central GDSS Server"]
  B --> C["Data Analysis Engine"]
  C --> D["Signal Timing Model"]
  D --> E["Adjusted Traffic Lights"]
  E --> F["Reduced Congestion"]
4. Tools and Techniques in DSS
4.1 OLAP (Online Analytical Processing)
OLAP enables multidimensional analysis of data, allowing users to:
- Slice and dice data (e.g., view sales by region, product, and time).
- Perform drill-down (e.g., from total sales to daily sales per store).
- Use pivot tables for dynamic reporting.
Example: Nabil Bank’s Loan Portfolio Analysis Nabil Bank uses OLAP to analyze loan defaults across branches. A manager can:
- Slice: View defaults by branch.
- Dice: Compare defaults by loan type (e.g., personal vs. business).
- Drill-down: See individual borrower details.
4.2 What-If Analysis
A tool to simulate scenarios before making decisions. For example:
- Daraz’s Warehouse Location: What if we open a new warehouse in Pokhara? The DSS can simulate delivery times and costs.
- NTC’s Network Expansion: What if we add 100 new towers? The model predicts coverage and ROI.
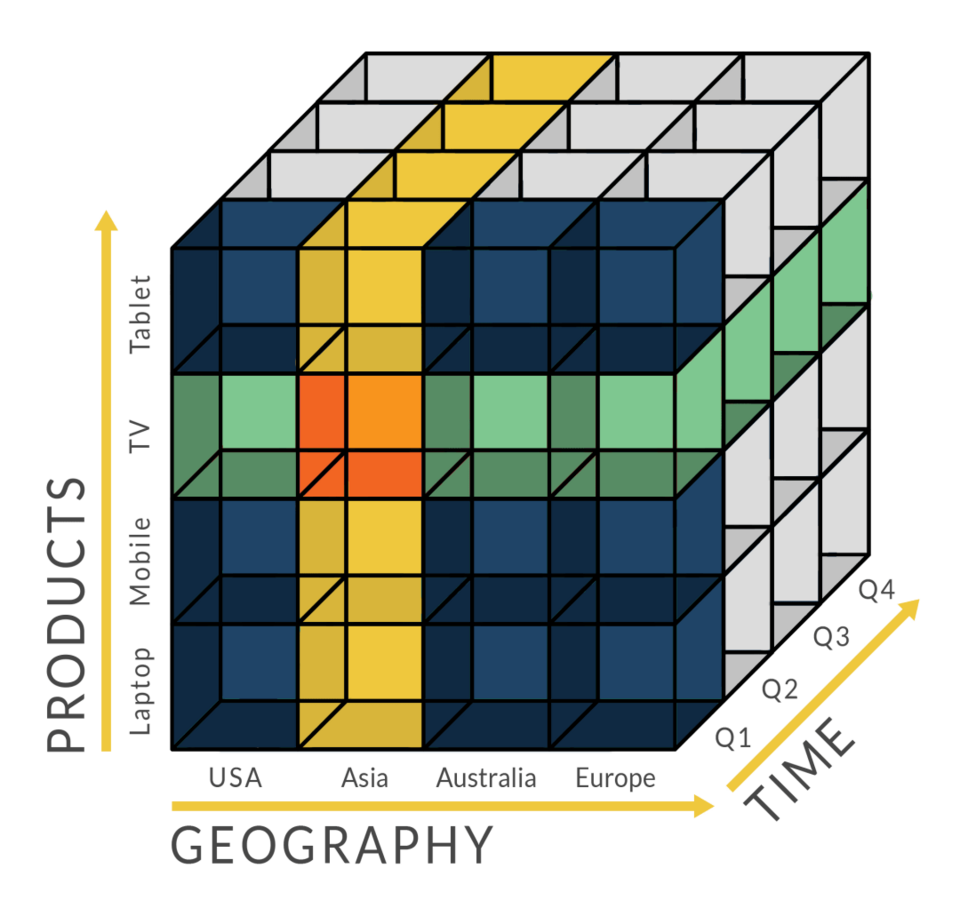 A 3D cube showing dimensions like Time, Product, and Region. (Image: Margaret Rouse, olap.com, Guru99, CC BY-SA 4.0, via Wikimedia Commons)
5. Advantages and Limitations of DSS
| Advantages | Limitations |
|---|---|
| Improves decision accuracy with data. | High initial setup cost. |
| Reduces bias in group decisions. | Requires trained users. |
| Enables faster scenario analysis. | Over-reliance on models may ignore human intuition. |
| Supports strategic planning. | Data quality issues can lead to bad decisions. |
6. Case Study: Nepal Stock Exchange (NEPSE) and DSS
Problem: NEPSE needed to predict market trends and identify high-risk stocks to prevent crashes. Solution: Implemented a hybrid DSS combining:
- Data-Driven: Historical stock prices, trading volumes.
- Model-Driven: Machine learning for trend prediction.
- Knowledge-Driven: Expert rules from economists.
Outcome:
- Reduced false trading signals by 30%.
- Enabled early warnings for volatile stocks (e.g., during the 2020 COVID-19 dip).
In the Real World
eSewa’s Fraud Detection
- Idea Used: Knowledge-Driven DSS with rule-based systems.
- How: eSewa’s DSS flags suspicious transactions (e.g., sudden large payments) by comparing them against user behavior patterns. If a transaction deviates from the norm (e.g., a farmer in Pokhara suddenly paying for a luxury watch), the system triggers a manual review.
Pathao’s Dynamic Pricing
- Idea Used: Data-Driven DSS with real-time demand-supply analysis.
- How: During peak hours (e.g., 7–9 PM in Kathmandu), Pathao’s algorithm increases fares by 20–50% if driver supply is low. This balances demand and ensures drivers earn more during busy times. The system uses OLAP to analyze historical surge pricing data.
NTC’s Network Optimization
- Idea Used: Model-Driven DSS for linear programming.
- How: NTC uses DSS to optimize the placement of 4G towers in remote areas like Dolpa. The model calculates the minimum number of towers needed to cover 90% of the population while minimizing costs. This reduced capital expenditure by 18% in the last fiscal year.
Exam Tip
Compare DSS Types: Always relate examples to the four DSS types (model-driven, data-driven, etc.). For instance:
- "Nepal Rastra Bank uses a model-driven DSS for inflation forecasting, while Daraz uses a data-driven DSS for pricing."
Simon’s Models: Expect short-answer questions on the differences between rational, bounded rationality, and intuitive models. Use the mindmap above to recall key points.
Case Study Application: In long-answer questions, apply DSS concepts to real scenarios:
- "How would you design a DSS for Khalti’s loan approval process?" Answer: Use a hybrid DSS—data-driven for credit scoring, knowledge-driven for fraud rules, and communication-driven for team reviews.
OLAP and What-If: Be ready to explain OLAP operations (slice, dice, drill-down) and what-if scenarios with numerical examples. For instance:
- "If Nabil Bank increases its loan interest rate by 2%, how would it affect default rates?" (Use a hypothetical table with before/after scenarios.)
Group DSS: Highlight collaboration benefits in exams. For example:
- "GDSS helps Nepal Investment Bank’s loan committees avoid groupthink by allowing anonymous voting on risky loans."
Final Note: Business Intelligence exams test both theory and application. Always tie concepts to real-world examples (e.g., NTC, Daraz, banks) to score full marks. Practice drawing DSS architectures and OLAP cubes in your notes—they often appear in diagrams!
Based on the TU BITM syllabus for Business Intelligence (IT249), unit 2.
Discussion
Loading…