Cognitive ScienceUnit 610 min read
Brain Mapping: Techniques, Tools & Cognitive Insights
Unit 6 of Cognitive Science explores brain mapping methods (EEG, fMRI, PET, TMS), their working principles, applications in neuroscience, and how they reveal cognitive functions. Learn how these tools decode brain activity, limitations, and real-world uses in medicine and tech.
TAKEAWAYS:
- Brain mapping uses non-invasive (EEG, fMRI) and invasive (electrodes) techniques to visualize brain activity linked to cognition, emotions, and motor functions.
- fMRI detects blood-oxygen changes to map active brain regions, while EEG records electrical signals with millisecond precision but poor spatial resolution.
- PET scans track metabolic activity using radioactive tracers, useful for studying neurodegenerative diseases like Alzheimer’s.
- TMS (Transcranial Magnetic Stimulation) temporarily disrupts brain regions to test their role in functions like language or memory.
- Neuroimaging data helps decode cognitive processes (e.g., decision-making, language) and informs treatments for disorders like epilepsy or Parkinson’s.
- Ethical and technical challenges (cost, invasiveness, signal noise) limit widespread adoption in clinical or consumer settings.
1. What Is Brain Mapping?
Brain mapping is the systematic study of brain structure and function using imaging and recording techniques. It answers:
- Which brain regions activate during tasks (e.g., reading, problem-solving)?
- How do neural circuits support cognition (memory, attention, language)?
- How do injuries or diseases alter brain function?
Key Techniques Compared
| Method | How It Works | Resolution | Temporal Resolution | Invasive? | Key Uses |
|---|---|---|---|---|---|
| EEG | Electrodes on scalp measure electrical activity | Poor (cm-scale) | Milliseconds (ms) | No | Epilepsy monitoring, sleep studies |
| fMRI | Detects blood-oxygen changes (BOLD signal) | High (mm-scale) | Seconds (s) | No | Cognitive task mapping, stroke recovery |
| PET | Radioactive tracers track metabolic activity | Moderate (cm-scale) | Minutes (min) | No | Alzheimer’s, cancer brain studies |
| TMS | Magnetic pulses disrupt brain regions temporarily | Targeted (local) | Milliseconds (ms) | No | Depression treatment, motor cortex mapping |
| Intracranial EEG | Electrodes implanted in brain tissue | Very high (µm-scale) | Milliseconds (ms) | Yes | Epilepsy surgery planning |
2. How Do These Tools Work?
A. Electroencephalography (EEG)
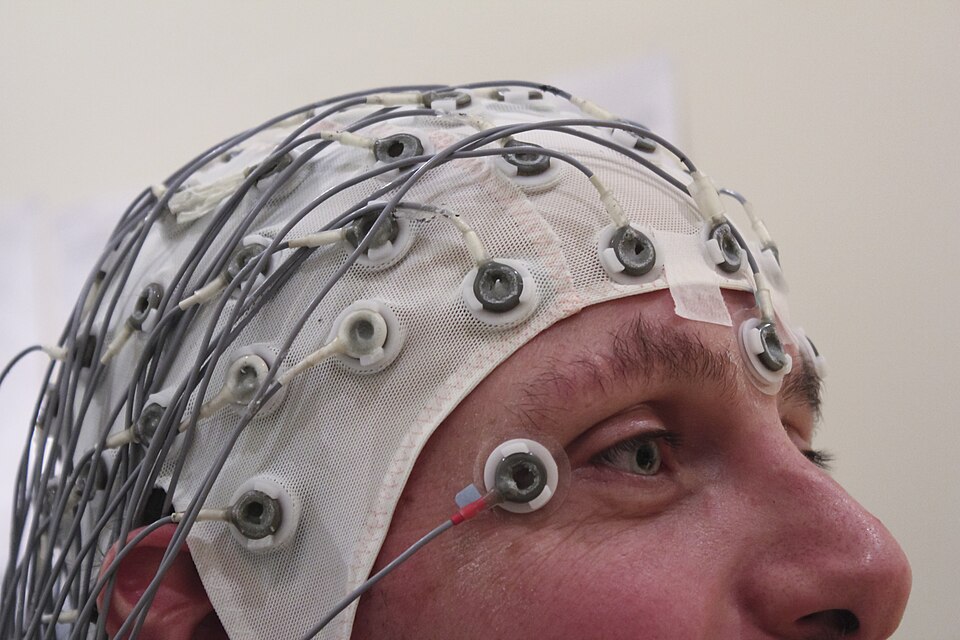 EEG electrodes placed on scalp to record brain waves (delta, theta, alpha, beta, gamma). (Image: Chris Hope, CC BY 2.0, via Wikimedia Commons)
- Principle: Electrodes detect postsynaptic potentials (electrical signals from neurons) via voltage changes on the scalp.
- Wave Types:
- Delta (0.5–4 Hz): Deep sleep.
- Theta (4–8 Hz): Memory, drowsiness.
- Alpha (8–12 Hz): Relaxed wakefulness.
- Beta (12–30 Hz): Active thinking.
- Gamma (>30 Hz): High cognition (e.g., problem-solving).
- Limitations:
- Poor spatial resolution (cannot pinpoint exact source).
- Sensitive to muscle noise (artifacts).
Worked Example: Reading a Brainwave Pattern Scenario: A student studies for an exam. Their EEG shows beta waves (15–25 Hz) in the frontal lobe (focus) and alpha waves (10 Hz) in the occipital lobe (relaxed eyes closed). Interpretation:
- Frontal beta = active problem-solving.
- Occipital alpha = eyes closed (no visual input). Real-World Link: Apps like Muse Headband (used by meditators) track alpha/beta waves to guide relaxation.
B. Functional Magnetic Resonance Imaging (fMRI)
- Principle: Measures Blood-Oxygen-Level-Dependent (BOLD) signal.
- Active neurons consume oxygen → blood flow increases → hemoglobin changes → detected by MRI.
- Steps:
- Subject performs a task (e.g., moving fingers).
- Scanner takes rapid images (every 2–3 seconds).
- Software compares "task" vs. "rest" images to highlight active regions.
- Example Output:
graph LR
  A["Task: Press Button"] --> B["Motor Cortex Activates"]
  B --> C["fMRI Detects BOLD Signal"]
  C --> D["Highlighted in Scan"]
Worked Example: Mapping Language Areas Scenario: A patient undergoes fMRI while naming objects.
- Result: Left Broca’s area (speech production) and Wernicke’s area (language comprehension) light up.
- Clinical Use: Helps surgeons avoid damaging these areas during tumor removal.
In the Real World:
- Nepal’s NTC: Uses fMRI-like principles in traffic flow optimization (though not brain scans!). Sensors track "active" roads (high traffic = "high BOLD-like" demand), helping reroute buses to reduce congestion.
- Google DeepMind: Trains AI on fMRI data to predict which brain regions activate during decision-making, aiding adaptive algorithms for search engines.
C. Positron Emission Tomography (PET)
- Principle: Injects radioactive glucose (FDG). Cancerous or active brain regions consume more glucose → emits positrons → detected by scanner.
- Applications:
- Alzheimer’s: Shows reduced metabolism in hippocampus.
- Epilepsy: Identifies seizure foci.
- Limitation: Low resolution (blurry images) and radiation exposure.
Worked Example: Alzheimer’s Diagnosis Scenario: A 60-year-old shows memory loss. PET scan reveals:
- Hypometabolism in hippocampus (red = low glucose uptake).
- Conclusion: Early Alzheimer’s → treatment with cholinesterase inhibitors.
D. Transcranial Magnetic Stimulation (TMS)
- Principle: Magnetic pulses create electric currents in neurons, temporarily "silencing" or activating regions.
- Uses:
- Treatment: Approved for depression (stimulates dorsolateral prefrontal cortex).
- Research: Tests causality (e.g., "Does the motor cortex control hand movements?").
- Example:
sequenceDiagram
  participant TMS as TMS Device
  participant Brain as Motor Cortex
  TMS->>Brain: Magnetic Pulse (1 sec)
  Brain-->>TMS: Muscle Twitch (if motor area stimulated)
In the Real World:
- Pathao Drivers: Unaware, but their decision-making under stress (e.g., avoiding accidents) is studied using TMS in labs. Researchers map the prefrontal cortex’s role in risk assessment to improve AI route-planning for ride-hailing apps.
- Nepal’s Banks: TMS is used experimentally to study how fraudsters’ brains differ in risk-taking. For example, a scammer’s ventromedial prefrontal cortex (linked to impulse control) may show abnormal activity.
3. Brain Mapping in Cognitive Science
Brain mapping reveals how cognition emerges from neural activity:
- Memory: Hippocampus activates during recall (fMRI).
- Attention: Parietal lobe lights up when filtering distractions (EEG).
- Language: Left hemisphere dominance in most people (PET).
Case Study: The "Taxi Driver" Brain
- London Taxi Drivers have enlarged hippocampi due to memorizing 25,000 streets.
- fMRI Study: Shows hippocampal growth correlates with navigation skill.
- Real-World Tie: Like Khalti’s fraud detection system, which uses pattern recognition (a cognitive process) to flag unusual transactions. Brain studies of risk perception help design better alert systems.
4. Challenges and Ethics
| Challenge | Example | Solution |
|---|---|---|
| Cost | fMRI scans cost $1,000–$2,000 per session | Use cheaper EEG for initial screening |
| Invasiveness | Intracranial EEG requires surgery | Non-invasive alternatives (TMS) |
| Signal Noise | EEG artifacts from blinking/muscle movement | Blind source separation algorithms |
| Ethics | Privacy: Who owns brain data? | Anonymization, informed consent |
Ethical Dilemma:
- Neuroprivacy: If a company like Daraz scans employees’ brainwaves to predict job performance, is it ethical?
- Solution: Laws like GDPR (Europe) require explicit consent for neurodata use.
5. Future Directions
- Brain-Computer Interfaces (BCIs): Companies like Neuralink use electrodes to decode motor intentions (e.g., typing with thoughts).
- Portable EEG: Headbands (e.g., Emotiv) for gaming or meditation apps.
- AI + fMRI: Google’s DeepMind uses fMRI data to train AI models of the brain.
Worked Example: Neuralink’s Brain Chip Scenario: A paralyzed patient controls a cursor by thinking.
- How:
- Electrodes record motor cortex signals.
- AI decodes intended movement (e.g., "move right").
- Robot arm executes the command.
- Real-World Link: Like Nepal’s NEPSE stock trading, where traders rely on pattern recognition (a cognitive process) to predict market moves. BCIs could one day let traders "think" orders directly into the system.
Exam Tip
- Define Clearly: For each method (EEG, fMRI, etc.), explain:
- Principle (e.g., "fMRI measures BOLD signal").
- Strengths/Weaknesses (e.g., "EEG is cheap but low resolution").
- Compare Tables: Exams often ask to contrast EEG vs. fMRI or PET vs. TMS. Use the table above as a template.
- Apply to Cognition: Link techniques to cognitive functions:
- "How would you use EEG to study attention deficits in ADHD?"
- "Which brain region does fMRI show activates during language processing?"
- Real-World Questions: Expect applications like:
- "How could TMS help depression patients in Nepal?"
- "Why is PET useful for Alzheimer’s research?"
- Diagrams: Draw BOLD signal graphs or EEG wave patterns in exams. Even a rough sketch earns partial credit.
Visual Summary:
mindmap
  root((Brain Mapping))
    Techniques
      EEG["Electrical Activity\n• Scalp electrodes\n• Millisecond timing"]
      fMRI["Blood Flow\n• BOLD signal\n• High spatial resolution"]
      PET["Metabolic Activity\n• Radioactive tracers\n• Low resolution"]
      TMS["Magnetic Stimulation\n• Temporary disruption\n• Therapy/research"]
    Applications
      Medicine["Epilepsy, Alzheimer’s"]
      Cognitive Science["Memory, attention studies"]
      Tech["BCIs, AI training"]
    Challenges
      Cost["Expensive scans"]
      Ethics["Privacy concerns"]
      Noise["Artifacts in EEG"]
Based on the TU BSc CSIT syllabus for Cognitive Science, unit 6.
Discussion
Loading…