Software Project ManagementUnit 113 min read
Software Project Management: Basics, Cycles, Plans & Evaluation
Unit 1 of Software Project Management covers core concepts like project definitions, management cycles, types of software projects, project plans, and financial evaluation techniques (payback period, ROI, NPV, IRR) with real-world examples from Nepalese tech companies and step-by-step calculations.
TAKEAWAYS:
- Understand the project management cycle (initiation, planning, execution, monitoring, closure) and its phases with visual precedence diagrams.
- Differentiate software project categories (custom vs. packaged, internal vs. external) and their unique challenges.
- Master project plan types (master, summary, detailed) and visualization techniques (Gantt charts, precedence diagrams, burndown charts).
- Calculate financial metrics (payback period, ROI, NPV, IRR) using discounted cash flow methods, with worked examples tied to Ncell’s app development or Daraz’s logistics software.
- Learn why discounted cash flow (DCF) techniques (NPV, IRR) are superior to simple ROI for project selection, using a comparison table.
- Apply critical path analysis to shorten project timelines, visualized via a precedence network diagram for a Kathmandu traffic optimization project.
1. What is Software Project Management?
Software Project Management (SPM) is the application of knowledge, skills, tools, and techniques to software projects to meet stakeholder needs. It ensures projects are completed on time, within budget, and with the required quality.
Key Definitions
- Project: A temporary endeavor to create a unique product/service (e.g., developing eSewa’s new payment gateway).
- Program: A group of related projects managed together (e.g., Ncell’s 5G rollout across Nepal).
- Portfolio: A collection of projects/programs aligned with organizational strategy (e.g., NTC’s digital transformation initiatives).
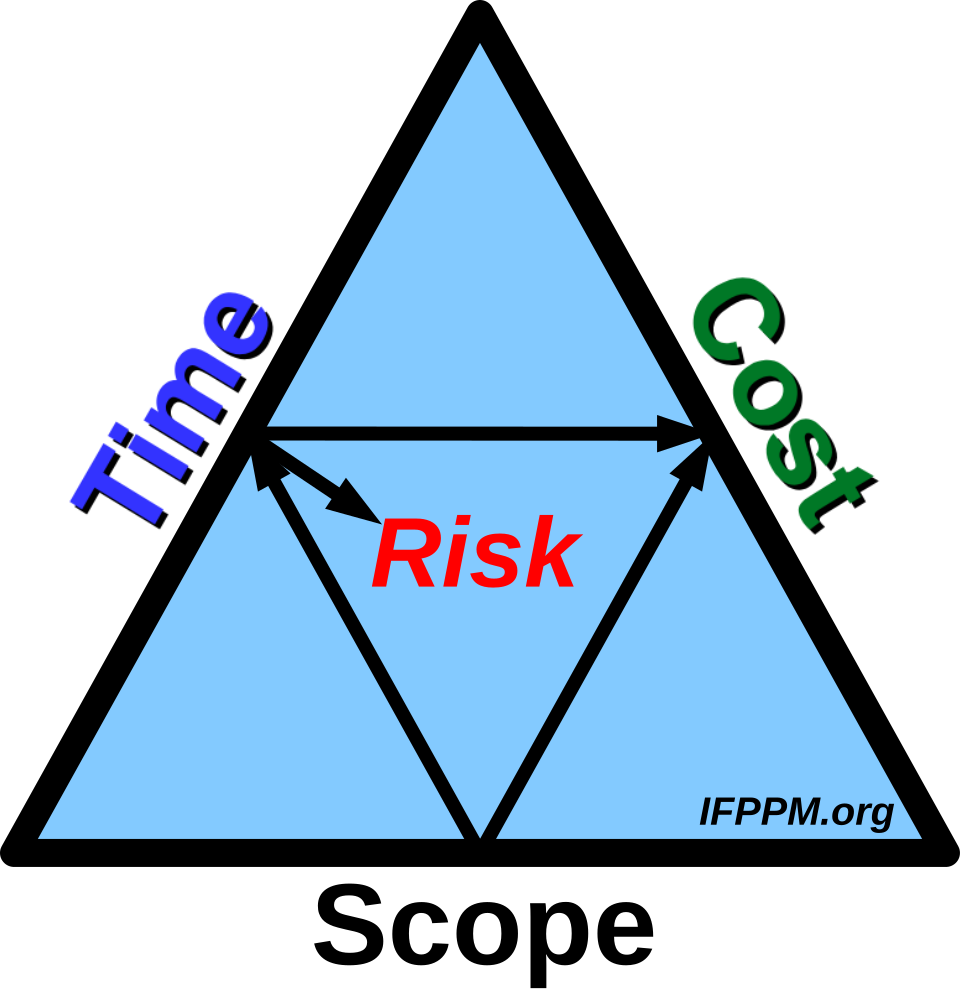 The classic Iron Triangle of scope, time, and cost trade-offs in software projects. (Image: Practicalpm, CC BY-SA 4.0, via Wikimedia Commons)
2. The Software Project Management Cycle
The project lifecycle follows a predictable cycle with five phases:
flowchart TD
    [*] --> Initiation
    Initiation --> Planning: "Feasibility Study\n(Requirements, Budget, Timeline)"
    Planning --> Execution: "Approved Plan\n(Tasks, Resources, Timeline)"
    Execution --> Monitoring: "Progress Tracking\n(Reports, Risks, Adjustments)"
    Monitoring --> Closure: "Deliverables Accepted\n(Documentation, Handover)"
    Closure --> [*]
Phase Breakdown
| Phase | Key Activities | Deliverables |
|---|---|---|
| Initiation | Define objectives, stakeholders, constraints, and feasibility. | Project Charter |
| Planning | Create WBS, schedules, budgets, risk plans, and quality standards. | Project Plan, Gantt Chart, Budget |
| Execution | Develop software, manage teams, and acquire resources. | Software Product, Milestones |
| Monitoring | Track progress, manage changes, and mitigate risks. | Status Reports, Burndown Charts |
| Closure | Hand over deliverables, document lessons learned, and release resources. | Final Report, Closed Project Documentation |
Worked Example: eSewa’s Mobile App Update
- Initiation: Goal = improve user experience for online payments.
- Planning: 6-month timeline, budget = Rs. 5M, team = 10 developers + 2 testers.
- Execution: Agile sprints, weekly demos.
- Monitoring: Burndown chart shows 80% completion at 4 months.
- Closure: App launched with 95% user satisfaction.
3. Types of Software Projects
Software projects are categorized based on scope, ownership, and delivery model:
| Category | Description | Example (Nepal) | Challenges |
|---|---|---|---|
| Custom vs. Packaged | Custom = built for a specific client; Packaged = off-the-shelf (e.g., ERP). | Custom: Ncell’s internal CRM system. | High cost, long development time. |
| Internal vs. External | Internal = for company use; External = sold to clients. | Internal: NTC’s network monitoring tool. | Security risks, stakeholder alignment. |
| Product vs. Service | Product = tangible software; Service = ongoing support/maintenance. | Product: Daraz’s mobile app. | Maintenance costs, updates. |
| Innovative vs. Incremental | Innovative = new tech; Incremental = improvements to existing systems. | Innovative: Pathao’s AI route optimizer. | High risk, uncertain ROI. |
Why Categorize?
- Helps tailor management approaches (e.g., Agile for innovative projects, Waterfall for packaged software).
- Affects resource allocation (e.g., NEPSE’s trading platform needs strict regulatory compliance).
4. Project Plans: Types and Visualization
A project plan is a roadmap for execution. Three main types:
| Plan Type | Purpose | Visualization Tools |
|---|---|---|
| Master Plan | High-level overview for stakeholders. | Gantt Charts, Milestone Diagrams. |
| Summary Plan | Mid-level details for managers. | Precedence Diagrams, Work Breakdown Structure (WBS). |
| Detailed Plan | Granular tasks for teams. | Burndown Charts, Kanban Boards. |
Visualization Techniques
- Gantt Charts: Show timelines and dependencies.
gantt
  title Daraz Logistics Software Development
  dateFormat  YYYY-MM
  section Development
  Backend API    :a1, 2023-01-01, 6w
  Frontend UI    :a2, after a1, 4w
  Testing        :a3, 2023-03-01, 3w
  Deployment     :a4, after a3, 1w
- Precedence Diagrams (PDM): Show task dependencies and critical paths.
flowchart TD
  A["Requirements Gathering"] --> B["Design"]
  A --> C["Prototyping"]
  B --> D["Development"]
  C --> D
  D --> E["Testing"]
  E --> F["Deployment"]
- Burndown Charts: Track work remaining vs. time (used in Agile).
5. Financial Evaluation Techniques
Projects must be economically viable. Key metrics:
A. Payback Period (PP)
- Definition: Time to recover initial investment.
- Formula:
- Example: Ncell’s new app costs Rs. 200,000. Cash flows:
Year Cash Flow (Rs.) 0 -200,000 1 100,000 2 50,000 3 50,000 Calculation: - After Year 2: Rs. 200,000 - (100,000 + 50,000) = Rs. 50,000 remaining.
- Year 3 cash flow = Rs. 50,000 → PP = 2 + (50,000 / 50,000) = 3 years.
B. Return on Investment (ROI)
- Definition: Profitability of an investment.
- Formula:
- Example: Daraz’s new warehouse software costs Rs. 50,000. Net profits:
Year Net Profit (Rs.) 1 5,000 2 5,000 3 20,000 4 40,000 5 50,000 Calculation: - Total Net Profit = 5,000 + 5,000 + 20,000 + 40,000 + 50,000 = Rs. 120,000.
- ROI = (120,000 / 50,000) × 100% = 240%.
C. Discounted Cash Flow (DCF) Techniques
Why DCF?
- Accounts for time value of money (Rs. 1 today > Rs. 1 in 5 years).
- NPV (Net Present Value): If NPV > 0, project is profitable.
- IRR (Internal Rate of Return): Discount rate where NPV = 0.
Comparison Table
| Metric | Formula | Advantages | Disadvantages |
|---|---|---|---|
| Payback Period | Time to recover initial cost. | Simple, easy to understand. | Ignores cash flows after payback. |
| ROI | (Net Profit / Initial Investment) × 100% | Easy to communicate. | Doesn’t account for time value. |
| NPV | Considers time value, accurate. | Requires discount rate estimation. | |
| IRR | Rate where NPV = 0. | Considers time value, ranks projects. | May have multiple IRRs, complex calculation. |
Worked Example: NTC’s Fiber Optic Expansion
- Initial Cost: Rs. 1,000,000
- Cash Flows: Rs. 300,000/year for 5 years.
- Discount Rate (r): 10%
- NPV Calculation:
6. Critical Path Method (CPM)
The critical path is the longest duration path in a project network. Shortening it reduces project duration.
Example: Kathmandu Traffic Optimization Project
- Critical Path: A → B → D → E (10 weeks).
- Non-Critical Path: A → C → D (can be delayed by 1 week).
Shortening the Project:
- Add more sensors (reduce C from 3 to 2 weeks).
- New critical path: A → B → D → E (9 weeks).
7. In the Real World
eSewa’s Payment Gateway Upgrade
- Concept: Used precedence diagrams to map dependencies between backend API changes, security patches, and UI updates.
- Financial Evaluation: Calculated NPV to justify Rs. 3M investment (NPV = Rs. 4.2M at 12% discount rate).
Pathao’s Driver App
- Project Plan: Used burndown charts to track Agile sprints for real-time route optimization.
- Risk Management: Applied IRR to evaluate whether investing Rs. 2M in AI would yield >15% return (IRR = 18%).
Ncell’s 5G Network Rollout
- Critical Path: Identified tower installation → fiber connection → software configuration as the longest path (12 weeks).
- Cost Management: Used ROI to compare 5G vs. 4G upgrades (5G ROI = 320% over 5 years).
8. Exam Tip
For calculations (PP, ROI, NPV, IRR):
- Always show step-by-step workings.
- Use tables for cash flows (like the examples above).
- Remember: NPV > 0 = good project; IRR > discount rate = acceptable.
For diagrams:
- Precedence diagrams: Draw arrows for dependencies (e.g., "A must finish before B").
- Gantt charts: Label start/end dates and milestones.
- Burndown charts: Plot ideal vs. actual progress.
Definitions:
- Break-even point: When total revenue = total cost.
- Discounted cash flow: Adjusts future money to present value using a discount rate.
- Critical path: The sequence of tasks that cannot be delayed.
Common Pitfalls:
- Ignoring time value of money (use DCF, not simple ROI).
- Misidentifying the critical path (always pick the longest duration path).
- Forgetting to compare NPV and IRR (they can give conflicting signals in mutually exclusive projects).
Past Exam Patterns:
- 20%: Short definitions (e.g., "Define ROI").
- 30%: Calculations (PP, ROI, NPV).
- 30%: Diagrams (precedence, Gantt, burndown).
- 20%: Explanations (e.g., "Why is NPV better than ROI?").
Final Note: Software project management is about balancing trade-offs (time, cost, quality) while using data-driven decisions (financial metrics, visualizations). Practice drawing diagrams and calculating NPV/IRR—these are high-scoring areas!
Based on the TU BSc CSIT syllabus for Software Project Management (CSC415), unit 1.
Discussion
Loading…