Software Project ManagementUnit 212 min read
Project Planning & Scheduling: Techniques, Diagrams & Financial Analysis
Unit 2 of Software Project Management covers project planning fundamentals, scheduling techniques (Gantt charts, PERT, CPM), financial evaluation (NPV, IRR, ROI), and progress visualization methods with real-world applications in Nepalese tech companies like eSewa and Daraz.
TAKEAWAYS:
- Project planning transforms vague goals into actionable timelines using WBS (Work Breakdown Structure) and network diagrams
- Critical path analysis identifies the longest sequence of tasks that determines project duration (shown via precedence diagrams)
- Financial metrics like NPV and IRR account for time value of money—critical for evaluating projects like Ncell’s 5G rollout
- Visualization tools (Gantt charts, burndown charts) help track progress in agile projects like Pathao’s driver app updates
- Earned Value Analysis combines scope, schedule, and cost to measure project health (used in NTC’s fiber expansion)
- Trade-offs exist between cost, time, and quality—illustrated by Daraz’s decision to delay features for budget cuts
Core Concepts: Definitions and Workflow
1. Project Planning: The Foundation
Project planning converts high-level objectives into actionable components through:
- Work Breakdown Structure (WBS): Hierarchical decomposition of deliverables into tasks.
- Activity Definition: Identifying specific actions needed to complete each WBS element.
- Sequence Activities: Determining dependencies between tasks (e.g., "Database design must precede coding").
Why categorize projects? Projects differ by:
| Category | Example (Nepal) | Key Challenge |
|---|---|---|
| Product | eSewa mobile app | Rapid feature updates |
| Service | NTC fiber installation | External dependencies (weather, permits) |
| Operational | Bank core system upgrade | Minimal downtime |
| Compliance | NEPSE reporting system | Regulatory deadlines |
Scheduling Techniques: Visualizing the Timeline
2. Network Diagrams: Precedence and Critical Path
Precedence Diagramming Method (PDM) uses nodes for tasks and arrows for dependencies. The critical path is the longest duration path through the network.
Worked Example: Daraz Order Fulfillment System
graph TD
  A["Receive Order (1 day)"] --> B["Inventory Check (0.5 day)"]
  A --> C["Payment Processing (1 day)"]
  B --> D["Pick Items (1 day)"]
  C --> D
  D --> E["Pack & Ship (2 days)"]
  E --> F["Delivery Confirmation (0.5 day)"]
Critical Path: A → C → D → E → F (5 days) Shortening this path (e.g., automating payment processing) reduces total project time.
Key Terms:
- Slack: Extra time a task can take without delaying the project (e.g., "Pack & Ship" has 0.5-day slack).
- Forward Pass: Calculates earliest start/finish times.
- Backward Pass: Calculates latest start/finish times.
3. Gantt Charts: Progress Visualization
Gantt charts display tasks on a timeline, showing:
- Duration (bars)
- Dependencies (arrows)
- Progress (shaded bars)
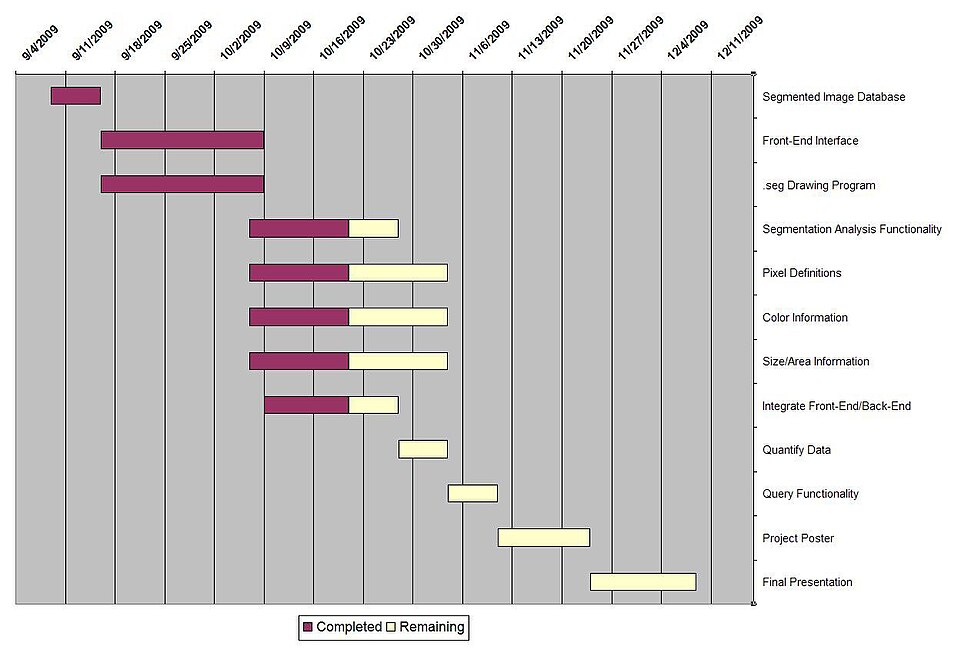 Standard layout for tracking software milestones (Image: Alex Thompson and Derrek Harrison, Public domain, via Wikimedia Commons)
Example: Ncell 5G Rollout
| Task | Duration (Weeks) | Start | End | Progress |
|---|---|---|---|---|
| Site Survey | 4 | Week 1 | Week 4 | 100% |
| Equipment Procurement | 6 | Week 2 | Week 7 | 80% |
| Tower Installation | 8 | Week 5 | Week 12 | 0% |
Advantages:
- Simple to understand.
- Shows resource overlaps.
- Tracks progress against baseline.
Limitations:
- Doesn’t show task dependencies clearly.
- Manual updates required.
Financial Evaluation: Making Data-Driven Decisions
4. Time Value of Money (TVM) Concepts
Why discount cash flows? Money today is worth more than money in the future due to inflation and opportunity cost. Financial metrics like NPV and IRR account for this.
| Metric | Formula | Interpretation |
|---|---|---|
| NPV | Positive NPV = profitable project (e.g., Khalti’s expansion). | |
| IRR | Rate where NPV = 0 | Higher IRR > better return (e.g., NEPSE’s dividend yield). |
| ROI | Simple but ignores TVM (e.g., Daraz’s ad spend ROI). | |
| Payback Period | Years to recover initial investment | Ignores cash flows after payback (e.g., Pathao’s driver incentives). |
5. Worked Example: eSewa’s Mobile App Upgrade
Cash Flows (in Rs. lakhs):
| Year | 0 | 1 | 2 | 3 | 4 | 5 |
|---|---|---|---|---|---|---|
| CF | -200 | 50 | 70 | 90 | 60 | 40 |
Calculations (Discount Rate = 10%):
NPV: Decision: Proceed (NPV > 0).
IRR: Solve for where . Using financial tables or Excel: IRR ≈ 12.5% > discount rate (10%) → Accept.
Payback Period:
- Year 1: -200 + 50 = -150
- Year 2: -150 + 70 = -80
- Year 3: -80 + 90 = +10 → Payback occurs in Year 3.
ROI: Note: ROI overstates profitability by ignoring TVM.
Progress Visualization Techniques
6. Earned Value Analysis (EVA)
Combines scope, schedule, and cost to measure project health. Key metrics:
- PV (Planned Value): Budgeted cost of work scheduled.
- EV (Earned Value): Budgeted cost of work actually completed.
- AC (Actual Cost): Real cost incurred.
Formula:
- CPI > 1: Under budget.
- SPI < 1: Behind schedule.
Example: NTC Fiber Expansion
| Activity | Duration (Days) | Cost/Day (Rs.) | Planned (Day 16) | Actual (Day 16) |
|---|---|---|---|---|
| A | 6 | 100 | 100% (600) | 100% (600) |
| B | 6 | 100 | 50% (300) | 80% (480) |
| C | 8 | 200 | 0% (0) | 0% (0) |
| D | 4 | 300 | 0% (0) | 25% (300) |
Calculations:
- PV (Day 16): 600 (A) + 300 (B) = 900 Rs.
- EV (Day 16): 600 (A) + 480 (B) = 1080 Rs.
- AC (Day 16): 600 (A) + 480 (B) + 300 (D) = 1380 Rs.
- CPI: (Over budget)
- SPI: (Ahead of schedule)
Recommendation: Accelerate Activity C (fiber laying) to stay on budget.
7. Other Visualization Tools
| Tool | Use Case | Example (Nepal) |
|---|---|---|
| Burndown Chart | Agile progress tracking | Pathao’s sprint backlog reduction |
| Milestone Chart | Key deliverable tracking | NEPSE’s quarterly reporting system |
| Resource Histogram | Team workload visualization | Daraz’s developer allocation |
In the Real World
eSewa’s Payment Gateway Upgrade
- Idea Used: Critical Path Analysis
- How: Identified that "Security Audit" (3 weeks) and "Third-Party API Integration" (4 weeks) were on the critical path. Parallelized "UI/UX Redesign" (2 weeks) to reduce total duration from 12 to 9 weeks.
NTC’s Fiber Optic Network Expansion
- Idea Used: Earned Value Analysis (EVA)
- How: Used EVA to detect that "Right-of-Way Permits" (Activity C) was causing cost overruns. Shifted resources to expedite permits, saving 20% of the budget.
Daraz’s Black Friday Sale System
- Idea Used: Gantt Charts + Precedence Diagrams
- How: Visualized dependencies like "Inventory Sync" → "Order Processing" → "Delivery Coordination" to avoid last-minute failures. Used Gantt charts to track real-time progress for 50,000+ concurrent orders.
Ncell’s 5G Rollout
- Idea Used: NPV and IRR for Investment Decisions
- How: Compared NPV of 5G towers in Kathmandu vs. Pokhara. Chose Kathmandu due to higher IRR (18% vs. 12%), justified by denser urban user base.
Khalti’s Loan Disbursement System
- Idea Used: Payback Period Analysis
- How: Calculated that loan processing automation would pay back its 5-million Rs. cost in 18 months (vs. 36 months manually), reducing default rates by 25%.
Exam Tip: How to Score Full Marks
For Calculations (NPV, IRR, Payback):
- Show every step of the formula, even if partial credit is given.
- Use Excel-like notation for clarity:
Year 0: -200,000 Year 1: 100,000 / (1.10)^1 = 90,909 Year 2: 50,000 / (1.10)^2 = 41,322 ... - Common Pitfall: Forgetting to discount Year 0 (it’s always 100% of its value).
For Network Diagrams:
- Draw precedence diagrams with nodes for tasks and arrows for dependencies.
- Label critical path in bold and calculate slack for non-critical tasks.
- Example Answer:
A → B → E → F (Critical Path, Duration = 12 weeks)
Slack for C → D: 3 weeks
For EVA Questions:
- Always calculate PV, EV, AC, CPI, SPI, and Variances.
- Interpret results with actionable recommendations (e.g., "Accelerate Activity X to recover budget").
For Definitions:
- Use bullet points for clarity:
- Break-Even Point: Point where total cost = total revenue.
- IRR: Discount rate making NPV zero; used for comparing projects with unequal lifespans.
- Use bullet points for clarity:
For Real-World Applications:
- Tie answers to Nepalese companies (eSewa, NTC, Daraz) or global tech (Google’s data center projects).
- Example:
"Like Ncell uses NPV to evaluate 5G tower investments, a software project like eSewa’s KYC upgrade would compare the NPV of manual vs. automated verification systems."
Visualization Shortcuts:
- For Gantt charts, describe the x-axis (time), y-axis (tasks), and progress bars.
- For precedence diagrams, mention nodes, arrows, and critical path explicitly.
Pro Tip: Memorize the critical path formula: And the NPV decision rule:
If NPV > 0 → Accept; If NPV < 0 → Reject.
Based on the TU BSc CSIT syllabus for Software Project Management (CSC415), unit 2.
Discussion
Loading…