Software Project ManagementUnit 412 min read
Project Cost Management & Financial Evaluation: Techniques, Metrics & Strategic Decisions
Unit 4 of Software Project Management covers cost estimation, financial evaluation techniques (NPV, IRR, ROI), break-even analysis, cost-benefit tradeoffs, and strategic financial assessment—with real-world examples from Nepali IT projects and global tech firms.
TAKEAWAYS:
- Cost management in software projects includes direct costs (development, hardware), indirect costs (overheads, training), and hidden costs (maintenance, scalability).
- Financial evaluation techniques like NPV, IRR, and ROI help compare projects using time-value-of-money principles.
- Break-even point determines when project benefits offset costs, critical for startups like Pathao or eSewa to justify investments.
- Cost-benefit analysis balances tangible (revenue) and intangible (brand reputation) factors—used by Ncell for network upgrades.
- Visualization tools (Gantt charts, S-curves) track cost performance against baselines, helping managers like Daraz’s logistics team optimize budgets.
- Strategic assessment aligns projects with organizational goals, using metrics like ROI to prioritize investments (e.g., NEPSE’s trading platform upgrades).
1. Cost Management in Software Projects
Cost management ensures projects stay within budget while delivering value. It involves:
- Estimating costs: Top-down (expert judgment) or bottom-up (detailed task breakdown).
- Budgeting: Allocating funds to phases (e.g., 40% to development, 20% to testing).
- Controlling costs: Monitoring variances (actual vs. planned) and taking corrective actions.
Types of Costs
| Category | Examples | Nepali Context |
|---|---|---|
| Direct Costs | Salaries, hardware, software licenses, outsourcing | eSewa’s server costs, Khalti’s payment gateway fees |
| Indirect Costs | Office rent, utilities, project management tools (e.g., Jira, Trello) | NTC’s internet infrastructure maintenance |
| Hidden Costs | Training, maintenance, scalability upgrades, security patches | Pathao’s driver app updates, Daraz’s warehouse expansions |
Worked Example: Cost Estimation for a Mobile App
Assume a Khalti-like payment app with:
- Development team: 5 developers × 6 months × ₹50,000/month = ₹15,00,000
- Hardware: 2 servers × ₹2,00,000 = ₹4,00,000
- Software licenses: ₹5,00,000
- Testing: ₹3,00,000
- Contingency (10%): ₹2,70,000 Total Estimated Cost = ₹29,70,000
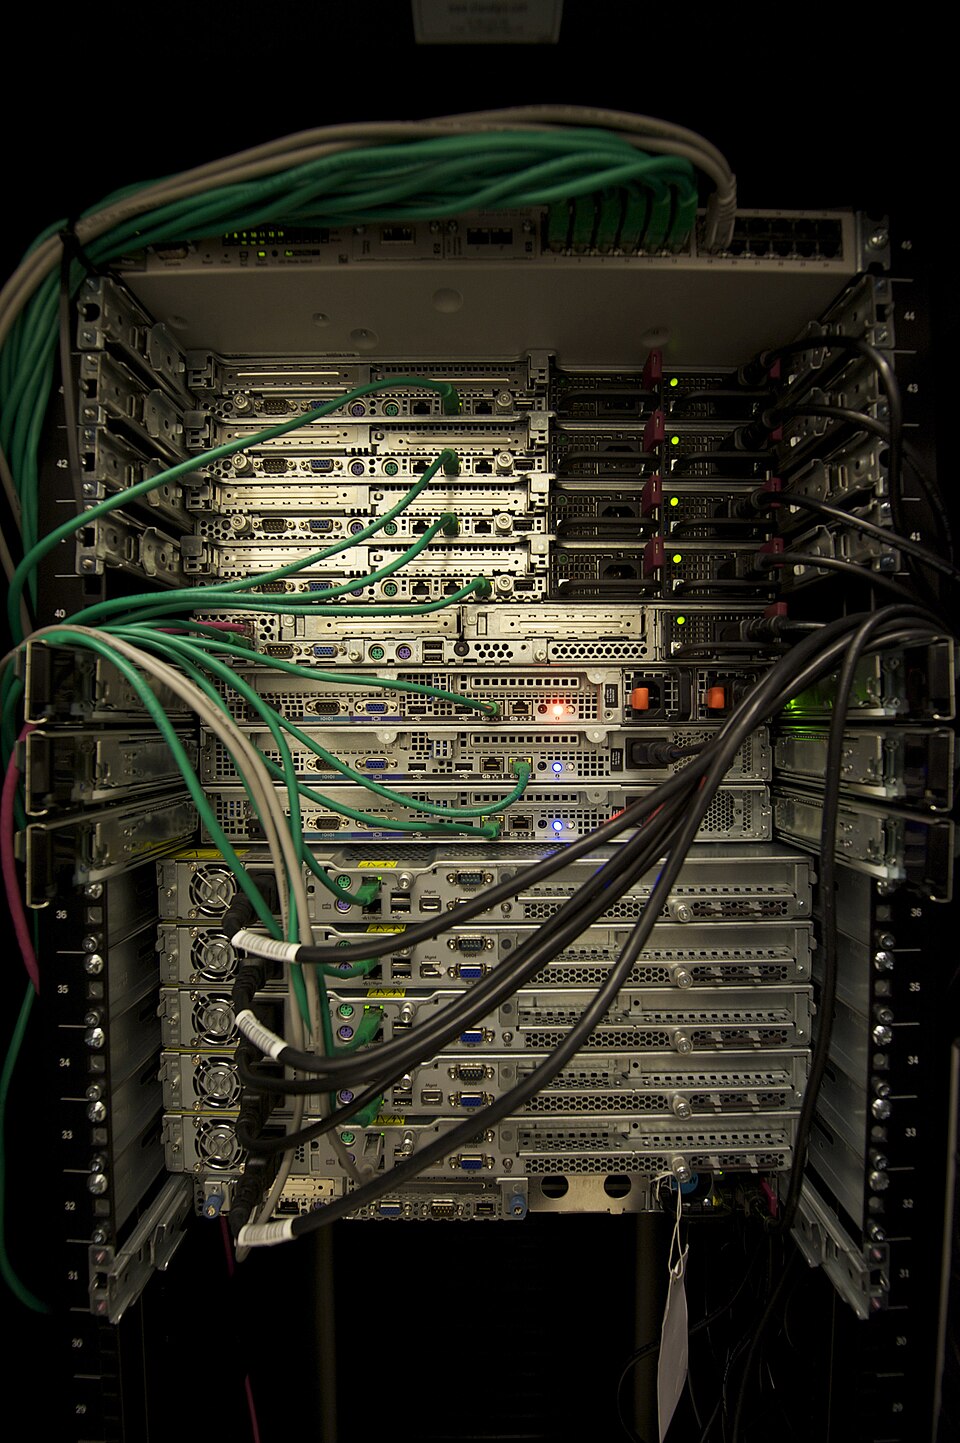 Colocation servers used by Nepali fintech firms like Khalti for payment processing (Image: Abigor, CC BY-SA 3.0, via Wikimedia Commons)
2. Financial Evaluation Techniques
These techniques help decide whether a project is financially viable.
A. Payback Period (PP)
Definition: Time required to recover initial investment from net cash inflows. Formula:
Worked Example: eSewa’s Digital Payment System
| Year | Cash Flow (₹) |
|---|---|
| 0 | -50,00,000 |
| 1 | 10,00,000 |
| 2 | 15,00,000 |
| 3 | 20,00,000 |
Calculation:
- After Year 2: Cumulative cash flow = ₹5,00,000 (still negative).
- Year 3 inflow: ₹20,00,000. Interpretation: eSewa recovers its investment in 4.25 years.
B. Net Present Value (NPV)
Definition: Difference between present value of cash inflows and outflows, adjusted for time value of money. Formula: Where:
- = Cash flow at time
- = Discount rate (e.g., 10%)
Worked Example: Ncell’s 5G Network Upgrade
| Year | Cash Flow (₹) | Discount Factor (10%) | Present Value (₹) |
|---|---|---|---|
| 0 | -10,00,00,000 | 1.00 | -10,00,00,000 |
| 1 | 3,00,00,000 | 0.909 | 27,27,00,000 |
| 2 | 4,00,00,000 | 0.826 | 33,04,00,000 |
| 3 | 5,00,00,000 | 0.751 | 37,55,00,000 |
| NPV | ₹ -1,23,00,000 |
Interpretation: Negative NPV suggests the project may not be viable at 10% discount rate. Ncell might reconsider or seek subsidies.
C. Internal Rate of Return (IRR)
Definition: Discount rate that makes NPV = 0. Higher IRR = better project. Worked Example: Daraz’s Warehouse Automation
| Year | Cash Flow (₹) |
|---|---|
| 0 | -2,00,00,000 |
| 1 | 50,00,000 |
| 2 | 70,00,000 |
| 3 | 80,00,000 |
Using financial calculators or Excel (=IRR()), IRR ≈ 28%.
Interpretation: If Daraz’s cost of capital is <28%, the project is profitable.
D. Return on Investment (ROI)
Definition: Profitability ratio comparing net gain to investment. Formula:
Worked Example: NEPSE’s Trading Platform Upgrade
- Initial Investment: ₹5,00,00,000
- Net Profit (Year 5): ₹1,50,00,000
MERMAID DIAGRAM: Financial Evaluation Techniques Comparison
3. Break-Even Analysis
Definition: Point where total revenue equals total costs. Used to determine feasibility. Formula:
Worked Example: Pathao’s Driver App
- Fixed Costs: Server costs (₹5,00,000/year)
- Variable Cost: Per-ride processing fee (₹20/ride)
- Revenue per Ride: ₹50
- Contribution Margin per Ride: ₹50 - ₹20 = ₹30 Interpretation: Pathao needs ~46 rides/day to break even.
4. Cost-Benefit Analysis (CBA)
Balances tangible (revenue, savings) and intangible (brand value, customer satisfaction) factors.
| Category | Examples |
|---|---|
| Tangible Benefits | Increased revenue, reduced operational costs |
| Intangible Benefits | Improved user experience, brand loyalty, regulatory compliance |
| Tangible Costs | Development, hardware, licenses |
| Intangible Costs | Risk of project failure, opportunity cost of alternative projects |
Worked Example: NTC’s Fiber Optic Expansion
| Factor | Tangible (₹) | Intangible |
|---|---|---|
| Benefits | +₹20,00,00,000 | Faster internet, national pride |
| Costs | -₹15,00,00,000 | Disruption during construction |
| Net Benefit | +₹5,00,00,000 | High intangible value for citizens |
MERMAID DIAGRAM: Cost-Benefit Analysis Process
flowchart TD
    A["Identify Costs & Benefits"] --> B["Quantify Tangible Factors"]
    B --> C["Assess Intangible Factors"]
    C --> D["Calculate Net Present Value"]
    D --> E["Sensitivity Analysis"]
    E --> F["Decision: Approve/Reject"]
5. Strategic Assessment
Aligns projects with organizational goals using:
- Financial Metrics: NPV, IRR, ROI.
- Strategic Fit: Does the project support long-term vision?
- Risk Assessment: Probability of success/failure.
- Resource Availability: Budget, team, technology.
Example: NEPSE’s Blockchain Project
- Financial: High initial cost (₹10 crore) but long-term ROI from reduced fraud.
- Strategic: Aligns with digital transformation goals.
- Risk: Low (proven technology, government backing).
- Resources: Dedicated IT team available.
6. Visualizing Project Costs
| Tool | Purpose | Example Use Case |
|---|---|---|
| Gantt Chart | Tracks cost vs. time, identifies delays | Daraz’s logistics budget tracking |
| S-Curve | Shows cumulative cost over time | Ncell’s 5G rollout cost monitoring |
| Earned Value Analysis | Compares planned vs. actual cost/performance | eSewa’s digital payment system |
| Cost Performance Index (CPI) | Measures cost efficiency: | Pathao’s app development |
MERMAID DIAGRAM: Earned Value Management (EVM)
In the Real World
eSewa’s Digital Payment System
- Concept: Uses NPV and IRR to evaluate expansion into rural areas.
- How: Calculates present value of future transactions (e.g., ₹10 crore/year for 5 years at 12% discount rate) to justify ₹2 crore investment in new servers.
Pathao’s Driver App Upgrades
- Concept: Break-even analysis determines minimum rides needed to cover server costs.
- How: With ₹5 lakh/month fixed costs and ₹30/contribution margin per ride, Pathao needs ~17,000 rides/month to break even.
Ncell’s 4G to 5G Transition
- Concept: ROI and Payback Period assesses profitability.
- How: ₹500 crore investment with ₹150 crore/year revenue → 3.3-year payback period and 30% ROI, making it viable.
Daraz’s Warehouse Automation
- Concept: Cost-Benefit Analysis balances tangible (faster deliveries) and intangible (customer satisfaction) gains.
- How: ₹20 crore automation saves ₹5 crore/year in labor costs while improving order accuracy.
NEPSE’s Trading Platform Security Upgrade
- Concept: NPV with risk adjustment evaluates cybersecurity investments.
- How: ₹1 crore upgrade prevents ₹10 crore/year in potential fraud → NPV > 0 even with 15% discount rate.
Exam Tip
Memorize Formulas:
- Payback Period, NPV, IRR, ROI, Break-Even Quantity.
- Example: For NPV, always show the discount table (like in the Ncell 5G example).
Practical Scenarios:
- Exams often ask for real-world applications (e.g., "How would Khalti use NPV?").
- Tip: Relate answers to Nepali IT firms (eSewa, Khalti, Ncell, Daraz).
Diagrams:
- Draw Gantt charts, S-curves, or EVM diagrams for visualization questions.
- Example: For a precedence network, show critical path with arrows.
Comparisons:
- Know advantages/disadvantages of each technique:
- Payback Period: Simple but ignores time value.
- NPV: Accurate but sensitive to discount rate.
- IRR: Useful but may have multiple rates.
- Know advantages/disadvantages of each technique:
Strategic Assessment:
- Link projects to organizational goals (e.g., "NTC’s fiber expansion supports digital Nepal").
Common Pitfalls:
- Forgetting to discount cash flows in NPV/IRR.
- Misinterpreting ROI (always use net profit, not gross).
- Ignoring intangible benefits in CBA (e.g., brand value).
Final Note: Always justify your answers with calculations and real-world ties. For example:
"Ncell should invest in 5G because its IRR of 28% exceeds the 15% cost of capital, aligning with its goal to dominate Nepal’s telecom market."
Based on the TU BSc CSIT syllabus for Software Project Management (CSC415), unit 4.
Discussion
Loading…