Software Project ManagementUnit 310 min read
Project Monitoring & Control: Techniques, Visualization & Critical Path
Unit 3 of Software Project Management covers real-time tracking of projects using metrics, visualization tools, and control mechanisms—including critical path analysis, earned value management, and risk-based adjustments—with practical examples from Nepali tech firms like eSewa and Daraz.
Key Concepts and Definitions
What is Project Monitoring and Control?
Project monitoring is the systematic observation of project progress to ensure it meets scope, schedule, and budget goals. Control involves taking corrective actions when deviations occur. Together, they form a feedback loop to keep projects on track.
stateDiagram-v2
    [*] --> Monitor: "Collect Data"
    Monitor --> Compare: "vs. Baseline"
    Compare --> Decide: "On Track?"
    Decide --> Control: "Yes" --> [*]
    Decide --> Adjust: "No" --> [*]
1. Techniques for Monitoring Progress
A. Earned Value Management (EVM)
EVM integrates scope, schedule, and cost into a single metric. Three key terms:
- Planned Value (PV): Budgeted cost of work scheduled.
- Earned Value (EV): Budgeted cost of work completed.
- Actual Cost (AC): Real cost incurred.
Formulas:
- Cost Variance (CV) = EV – AC (Positive = under budget; Negative = over budget)
- Schedule Variance (SV) = EV – PV (Positive = ahead of schedule; Negative = behind)
- Cost Performance Index (CPI) = EV / AC (>1 = efficient; <1 = inefficient)
- Schedule Performance Index (SPI) = EV / PV (>1 = ahead; <1 = behind)
Worked Example: eSewa’s Mobile App Update
Suppose eSewa planned a new payment feature with:
- PV (Month 1): ₹50,000 (budgeted cost for Month 1)
- EV (Month 1): ₹40,000 (actual work completed)
- AC (Month 1): ₹45,000 (real cost spent)
Calculations:
- CV = ₹40,000 – ₹45,000 = –₹5,000 (over budget)
- CPI = ₹40,000 / ₹45,000 ≈ 0.89 (inefficient)
- SV = ₹40,000 – ₹50,000 = –₹10,000 (behind schedule)
- SPI = ₹40,000 / ₹50,000 = 0.8 (delayed)
Action: eSewa’s team must reallocate resources or extend the deadline.
B. Critical Path Method (CPM)
The longest path through a project network determines the minimum project duration. Any delay on this path delays the entire project.
Steps to Find the Critical Path:
- Draw a precedence network diagram (activities as nodes, arrows as dependencies).
- Calculate Early Start (ES), Early Finish (EF), Late Start (LS), and Late Finish (LF) for each task.
- Identify tasks where LS = ES (or LF = EF)—these are on the critical path.
Worked Example: Daraz’s Order Fulfillment System
Activities and Dependencies:
| Activity | Duration (Days) | Predecessors |
|---|---|---|
| A | 5 | – |
| B | 3 | A |
| C | 7 | A |
| D | 2 | B, C |
| E | 4 | D |
Network Diagram:
graph TD
    A["A: 5"] --> B["B: 3"]
    A --> C["C: 7"]
    B --> D["D: 2"]
    C --> D
    D --> E["E: 4"]
Calculations:
| Task | ES | EF | LS | LF | Slack |
|---|---|---|---|---|---|
| A | 0 | 5 | 0 | 5 | 0 |
| B | 5 | 8 | 5 | 8 | 0 |
| C | 5 | 12 | 5 | 12 | 0 |
| D | 12 | 14 | 12 | 14 | 0 |
| E | 14 | 18 | 14 | 18 | 0 |
Critical Path: A → C → D → E (Total duration = 18 days)
Why? If Daraz delays C (warehouse processing), the entire order fulfillment is delayed.
2. Visualization Techniques
A. Gantt Charts
Shows tasks vs. time with bars representing progress.
Example: Pathao’s Driver App Development
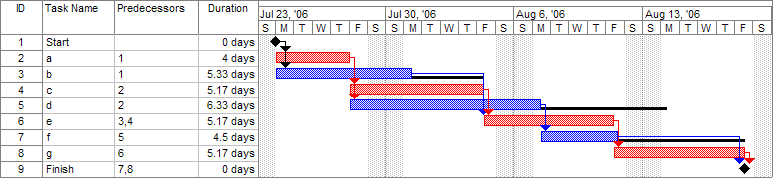
| Task | Jan | Feb | Mar | Apr |
|---|---|---|---|---|
| User Registration | ■■■ | ■■■ | ||
| Ride Booking | ■■■ | ■■■ | ||
| Payment Integration | ■■■ | ■■■ | ||
| Testing | ■■■ |
Advantages: ✔ Simple to understand. ✔ Shows dependencies clearly.
Disadvantages: ✖ Does not show cost or resource conflicts.
B. Burndown Charts
Tracks work remaining vs. time (common in Agile).
Example: Ncell’s App Bug Fixes

- Y-axis: Remaining work (story points).
- X-axis: Days in sprint.
- Goal: Reach zero by sprint end.
Advantages: ✔ Highlights progress toward goals. ✔ Helps teams adjust effort.
Disadvantages: ✖ Requires accurate story-point estimates.
C. Control Charts
Used in statistical process control (SPC) to monitor variations.
Example: NTC’s Network Latency Monitoring
- Upper Control Limit (UCL) and Lower Control Limit (LCL) define acceptable range.
- If a point falls outside, investigate (e.g., server overload).
3. Financial Monitoring Techniques
A. Discounted Payback Period (DPBP)
Considers time value of money (unlike simple payback).
Formula:
Worked Example: Bank Loan for a Software Startup
| Year | Cash Flow (₹) | Discounted Cash Flow (10% discount) |
|---|---|---|
| 0 | –200,000 | –200,000 |
| 1 | 100,000 | 90,909 |
| 2 | 50,000 | 41,322 |
| 3 | 50,000 | 37,566 |
| Cumulative | –200,000 + 90,909 = –109,091 (Year 1) | |
| –109,091 + 41,322 = –67,769 (Year 2) | ||
| –67,769 + 37,566 = –30,203 (Year 3) | ||
| –30,203 + 34,149 (Year 4) = +3,946 |
DPBP Calculation:
- Recovery occurs between Year 3 and Year 4.
- DPBP = 3 + (₹30,203 / ₹34,149) ≈ 3.89 years
Interpretation: The bank should approve the loan if the project’s expected life > 3.89 years.
B. Return on Investment (ROI)
Measures profitability of a project.
Formula:
Worked Example: NEPSE’s Trading Software
| Year | Net Cash Flow (₹) |
|---|---|
| 0 | –50,000 |
| 1 | 5,000 |
| 2 | 5,000 |
| 3 | 20,000 |
| 4 | 40,000 |
| 5 | 50,000 |
Total Net Profit = ₹120,000 ROI = (₹120,000 / ₹50,000) × 100% = 240%
Interpretation: For every ₹1 invested, NEPSE earns ₹2.40 over 5 years.
4. Risk-Based Monitoring
A. Risk Register
Tracks identified risks, their impact, and mitigation plans.
| Risk | Probability | Impact | Mitigation Plan |
|---|---|---|---|
| Delayed API access | High | High | Backup cloud provider |
| Team attrition | Medium | High | Cross-training |
| Budget overrun | Low | Medium | Contingency fund (5%) |
Example: If Khalti’s payment gateway fails, the risk register helps the team switch to IPS Payment Gateway immediately.
5. Why Discounted Cash Flow (DCF) is Better Than ROI
| Criteria | DCF Techniques (NPV, IRR) | ROI |
|---|---|---|
| Time Value | ✔ Considers inflation & opportunity cost | ❌ Ignores timing |
| Project Comparison | ✔ NPV ranks projects by absolute value | ❌ ROI can mislead for different investment sizes |
| Risk Adjustment | ✔ Can incorporate discount rates for risk | ❌ No risk factor |
| Decision Making | ✔ IRR helps compare projects with different lifespans | ❌ May favor short-term projects |
Example:
- Project A: High ROI (50%) but takes 10 years to recover.
- Project B: Lower ROI (20%) but recovers in 3 years. DCF helps choose B if the company needs quick returns.
In the Real World
eSewa’s Payment System
- Earned Value Management (EVM) is used to track progress of new features like QR code payments.
- If the EV < AC, eSewa’s team must optimize code or hire more developers.
Daraz’s Order Fulfillment
- Critical Path Analysis ensures that warehouse processing (C) does not delay shipments.
- If a delay occurs, Daraz reroutes orders to faster warehouses.
Ncell’s Network Monitoring
- Control Charts track latency spikes in 4G/5G networks.
- If latency exceeds UCL, Ncell deploys more towers or optimizes routing.
Nepal Rastra Bank’s Loan Approvals
- Discounted Payback Period (DPBP) is used to approve SME loans.
- A startup with DPBP = 4 years gets priority over one with DPBP = 7 years.
Pathao’s Driver App Updates
- Burndown Charts show if the team will finish sprint goals (e.g., adding electric vehicle support) on time.
Exam Tip
What Examiners Look For
Definitions:
- Clearly define EVM, CPM, DPBP, ROI, and risk register.
- Example: "Earned Value Management integrates scope, schedule, and cost into a single metric to assess project health."
Calculations:
- Always show steps for DPBP, ROI, and critical path.
- Use realistic numbers (e.g., ₹50,000 investments, 10% discount rates).
Diagrams:
- Draw precedence diagrams for CPM questions.
- Label all nodes and arrows (e.g., "A → B" with durations).
Comparisons:
- DCF vs. ROI: Explain why NPV is better for large projects (e.g., NTC’s fiber expansion).
- Gantt vs. Burndown: State when to use each (e.g., Gantt for waterfall, Burndown for Agile).
Real-World Applications:
- Tie examples to Nepali companies (e.g., "How would Khalti use EVM to monitor a new feature?").
- Avoid vague answers like "used in project management"—be specific!
Common Mistakes to Avoid
❌ Ignoring dependencies in CPM (e.g., missing that B depends on A). ❌ Forgetting to discount cash flows in DPBP/NPV. ❌ Miscounting slack in critical path (slack = LS – ES). ❌ Using simple payback instead of DPBP when asked for discounted metrics.
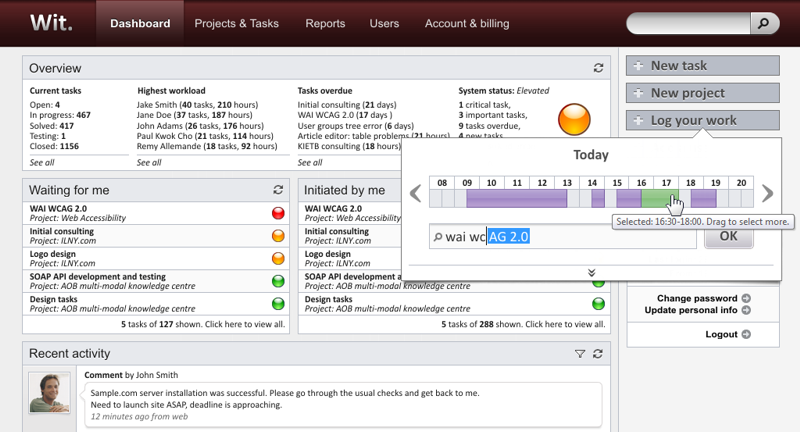 Tools like Jira and Trello visualize EVM and burndown charts (Image: Tombartal, CC BY-SA 3.0, via Wikimedia Commons)
Based on the TU BSc CSIT syllabus for Software Project Management (CSC415), unit 3.
Discussion
Loading…