Research MethodologyUnit 811 min read
Data Processing & Analysis: Techniques, Tools & Interpretation
Unit 8 of Research Methodology explores how raw data is transformed into meaningful insights through coding, cleaning, statistical analysis, and visualization—essential skills for tourism research, from guest satisfaction surveys to NEPSE stock trend analysis.
Core Concepts: What is Data Processing and Analysis?
Data processing is the systematic transformation of raw data into a structured format for analysis. It includes:
- Data cleaning (removing errors, duplicates, or inconsistencies)
- Data coding (assigning numerical values to categorical responses)
- Data reduction (summarizing large datasets)
- Statistical analysis (applying tests to interpret trends)
Data analysis, meanwhile, involves interpreting processed data to answer research questions or test hypotheses. Together, they form the backbone of evidence-based decision-making in tourism (e.g., analyzing visitor trends at Pashupatinath Temple or evaluating Ncell’s customer satisfaction scores).
1. Steps in Data Processing
Data processing follows a logical sequence:
flowchart TD
    A["Raw Data Collection"] --> B["Data Entry"]
    B --> C["Data Cleaning"]
    C --> D["Data Coding"]
    D --> E["Data Editing"]
    E --> F["Data Tabulation"]
    F --> G["Data Analysis"]
Key Sub-Steps Explained
| Step | Definition | Example in Tourism Research |
|---|---|---|
| Data Entry | Recording responses into a digital format (Excel, SPSS, R). | Entering survey responses from eSewa users about online payment convenience. |
| Data Cleaning | Fixing errors (e.g., missing values, typos). | Removing duplicate entries in a NTC customer complaint dataset. |
| Data Coding | Converting qualitative data (e.g., "Yes/No") into numerical values (1/0). | Coding "Highly Satisfied" as 5, "Neutral" as 3 in a Hotel Everest guest feedback survey. |
| Data Editing | Verifying accuracy and consistency. | Cross-checking NEPSE stock prices for missing days in a historical dataset. |
| Tabulation | Organizing data into tables (frequency distributions, cross-tabulations). | Creating a table of Pathao rider complaints by city (Kathmandu vs. Pokhara). |
2. Types of Data Analysis
Data analysis can be descriptive, inferential, or predictive, depending on the research goal.
Comparison Table: Descriptive vs. Inferential Analysis
| Feature | Descriptive Analysis | Inferential Analysis |
|---|---|---|
| Purpose | Summarizes data (mean, median, mode). | Draws conclusions about a population from a sample. |
| Example | Calculating the average age of Daraz shoppers. | Testing if Khalti users spend more than eSewa users. |
| Tools Used | Frequency tables, graphs, percentages. | Hypothesis tests (t-test, ANOVA), regression. |
| Output | "70% of tourists to Lumbini are international." | "There is a significant difference in satisfaction between domestic and international tourists (p < 0.05)." |
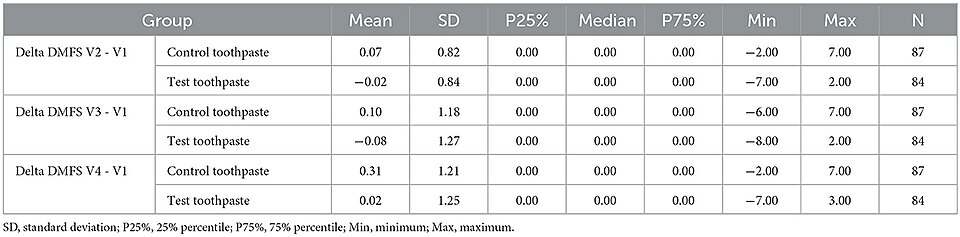 A screenshot of Excel/SPSS showing mean, median, standard deviation for a dataset. (Image: Authors of the study: Elzbieta Paszynska, Malgorzata Pawinsk, CC BY 4.0, via Wikimedia Commons)
3. Common Statistical Techniques
A. Measures of Central Tendency
- Mean: Average (sensitive to outliers). Example: If Ncell’s monthly data usage for 5 users is [10GB, 15GB, 20GB, 25GB, 100GB], the mean is 33GB (but 100GB skews it).
- Median: Middle value (less affected by outliers). Example: Median usage is 20GB (more reliable for NTC’s billing analysis).
- Mode: Most frequent value. Example: Mode of hotel ratings on Booking.com might be 4 stars.
B. Measures of Dispersion
| Measure | Formula | When to Use |
|---|---|---|
| Range | Max – Min | Quick overview of spread (e.g., price range of Daraz products). |
| Variance | Σ(x – mean)² / n | Assessing consistency (e.g., NEPSE stock volatility). |
| Standard Deviation | √Variance | Measuring risk (e.g., Pathao’s ride time variability). |
C. Hypothesis Testing
Hypothesis testing determines if observed differences are statistically significant.
- Null Hypothesis (H₀): No effect (e.g., "There is no difference in satisfaction between Hotel Yak & Yeti and Hotel Himalaya guests.").
- Alternative Hypothesis (H₁): There is an effect.
- p-value: Probability of observing data if H₀ is true. If p < 0.05, reject H₀.
Worked Example: Testing Guest Satisfaction Scenario: A hotel manager wants to know if Kathmandu’s luxury hotels have higher satisfaction scores than budget hotels.
- Collect data: Survey 100 guests from each category.
- Run a t-test:
- Luxury hotels: Mean satisfaction = 4.5 (SD = 0.5)
- Budget hotels: Mean satisfaction = 3.8 (SD = 0.7)
- Result: p = 0.001 (< 0.05) → Reject H₀. Luxury hotels have significantly higher satisfaction.
4. Data Visualization Techniques
Visuals make data intuitive. Common tools in tourism research:
| Visualization | When to Use | Example in Nepal |
|---|---|---|
| Bar Chart | Comparing categories (e.g., tourist arrivals by country). | Nepal Tourism Yearbook’s monthly visitor stats. |
| Pie Chart | Showing proportions (e.g., market share of Daraz vs. Sano Sansar). | Revenue distribution among NEPSE listed hotels. |
| Line Graph | Trends over time (e.g., NTC’s monthly call volume). | Ncell’s subscriber growth from 2010–2023. |
| Histogram | Distribution of continuous data (e.g., Pathao’s ride durations). | Frequency of eSewa transaction amounts. |
| Scatter Plot | Relationships between variables (e.g., price vs. ratings on Booking.com). | Correlation between NEPSE stock price and hotel occupancy rates. |
In the Real World
eSewa & Khalti
- Idea Used: Data Cleaning & Descriptive Analysis
- How: Both apps analyze transaction data to detect fraud (e.g., flagging unusual payment patterns). They use frequency distributions to identify peak usage hours (e.g., 6–9 PM for bill payments).
NEPSE (Nepal Stock Exchange)
- Idea Used: Inferential Statistics (Hypothesis Testing)
- How: Analysts test if Hotel Industry Stocks (e.g., Hotel Yak & Yeti) outperform the broader market. A regression analysis might show:
- H₀: No correlation between tourism season and stock prices.
- Result: p = 0.02 → Reject H₀. Stocks rise during peak seasons (Oct–Nov, Dec–Jan).
Pathao & Uber
- Idea Used: Data Tabulation & Predictive Analysis
- How: Ride-hailing apps use cross-tabulation to analyze:
- Rider demand by time (e.g., 8–10 AM in Kathmandu vs. Pokhara).
- Driver earnings by city.
- Predictive Model: Uses past data to forecast surge pricing during Dashain/Tihar festivals.
NTC (Nepal Telecom)
- Idea Used: Standard Deviation & Control Charts
- How: NTC monitors call drop rates across regions. If standard deviation exceeds a threshold, they investigate network issues in areas like Bhaktapur or Dharan.
Tourism Board of Nepal
- Idea Used: Geospatial Data Visualization
- How: Uses heatmaps to show tourist footfall in Chitwan National Park vs. Pokhara. Helps allocate resources (e.g., more guides in high-traffic zones).
Exam Tip
Understand the Difference Between Processing and Analysis
- Processing = Cleaning, coding, tabulating.
- Analysis = Interpreting with stats (mean, t-test, regression).
- Exam Question: "Distinguish between data cleaning and data coding with an example from Daraz’s customer reviews."
Practice SPSS/Excel
- Examiners often ask for screenshots of outputs (e.g., frequency tables, t-test results). Know how to:
- Run a descriptive analysis in Excel (
=AVERAGE(),=STDEV()). - Interpret SPSS p-values (e.g., "At p < 0.05, conclude that...").
- Run a descriptive analysis in Excel (
- Examiners often ask for screenshots of outputs (e.g., frequency tables, t-test results). Know how to:
Real-World Applications Are Key
- Always relate answers to Nepal’s tourism sector. For example:
- "How would you analyze Ncell’s customer churn data?" → Use logistic regression to predict churn based on call drop rates and billing issues.
- Always relate answers to Nepal’s tourism sector. For example:
Common Mistakes to Avoid
- Ignoring missing data: Always state how you handled it (e.g., "Deleted 5% of incomplete surveys").
- Misinterpreting p-values: p < 0.05 means statistically significant, not "practically significant."
- Overlooking units: Always label axes (e.g., "Number of Tourists (in thousands)").
Expected Questions
- Short Answer:
- "What is the purpose of data coding?"
- "Differentiate between mean and median with a NEPSE stock price example."
- Long Answer:
- "Explain the steps of data processing with a Hotel Everest guest feedback dataset."
- "How would you analyze Pathao’s rider satisfaction data using inferential statistics?"
- Case Study:
- "Given a dataset of Daraz’s monthly sales, how would you process and analyze it to recommend inventory strategies?"
- Short Answer:
Based on the TU BTTM syllabus for Research Methodology, unit 8.
Discussion
Loading…