Research MethodologyUnit 1013 min read
Research Report Writing: Structure, Formatting & Best Practices
Unit 10 of Research Methodology explores the art and science of crafting a professional research report—from logical structure and formatting to ethical presentation—with real-world examples from Nepalese tourism and global brands like eSewa and Google.
TAKEAWAYS:
- A research report must follow a standardized structure (title page, abstract, introduction, methodology, findings, conclusion, references) to ensure clarity and credibility.
- APA/MLA/Harvard citation styles are critical for avoiding plagiarism and maintaining academic integrity.
- Visual aids (tables, graphs, charts) must be labeled clearly and directly linked to the text to enhance readability.
- Ethical considerations (transparency, objectivity, proper attribution) are non-negotiable in research reporting.
- Real-world reports (e.g., NTC’s traffic analysis, Daraz’s customer satisfaction surveys) demonstrate how theory applies to business decisions.
- Proofreading and peer review are essential to eliminate errors and improve coherence before submission.
1. Definition and Purpose of a Research Report
A research report is a documented summary of a research study, presenting findings in a structured, objective, and professional manner. Its primary purposes are:
- To communicate research outcomes to stakeholders (academics, policymakers, businesses).
- To justify methodologies used in the study.
- To support decision-making (e.g., tourism policy reforms, business strategies).
Why does it matter? A poorly written report—even with strong findings—can discredit your work. Conversely, a well-structured report (like Nepal’s Central Bureau of Statistics’ tourism reports) can influence government policies.
2. Standard Structure of a Research Report
Every research report follows a logical flow to ensure clarity and credibility. Below is the universal structure with real-world applications:
A. Title Page
- Must include:
- Title (clear, concise, descriptive).
- Author(s) name(s).
- Institution/University.
- Date of submission.
- Example:
"Customer Satisfaction Analysis of Pathao Riders in Kathmandu Valley: A Mixed-Methods Study" Submitted to Tribhuvan University, 2024
B. Abstract (150–300 words)
- A miniature version of the report.
- Must answer:
- What was the research question?
- How was it conducted?
- What were the key findings?
- Example (from a real NTC report):
"This study analyzed traffic congestion in Kathmandu using GPS data from 5,000 vehicles. Key findings include a 40% increase in delays during peak hours (6–9 AM) and a direct correlation between congestion and economic losses in the tourism sector."
C. Introduction
- Hook the reader with background context.
- State the research problem (e.g., "Why are tourists dissatisfied with Nepal’s online visa processing?").
- Define objectives (e.g., "To assess delays in eVisa approvals and propose solutions.").
- Example (from a Daraz report):
"Despite Nepal’s growing e-commerce market, 60% of online shoppers abandon carts due to unclear return policies. This study examines customer perceptions of Daraz’s refund process."
D. Literature Review
- Synthesizes existing research on the topic.
- Compares theories (e.g., "Previous studies on customer satisfaction (Oliver, 2010) vs. Nepal’s context.").
- Identifies gaps your research fills.
- Visual Comparison:
Study Focus Gap Addressed NTC (2022) Traffic flow in Kathmandu No analysis of tourist impact Your Study (2024) Tourist delays due to congestion Links traffic to tourism revenue loss
E. Research Methodology
- How was data collected? (Surveys, interviews, experiments?)
- Why was this method chosen? (e.g., "Online surveys for 1,000 Pathao riders due to cost-effectiveness.")
- Example (from a Khalti study):
"A structured questionnaire was distributed to 500 Khalti users in Pokhara to assess digital payment satisfaction. The Likert scale (1–5) measured ease of use, security concerns, and transaction speed."
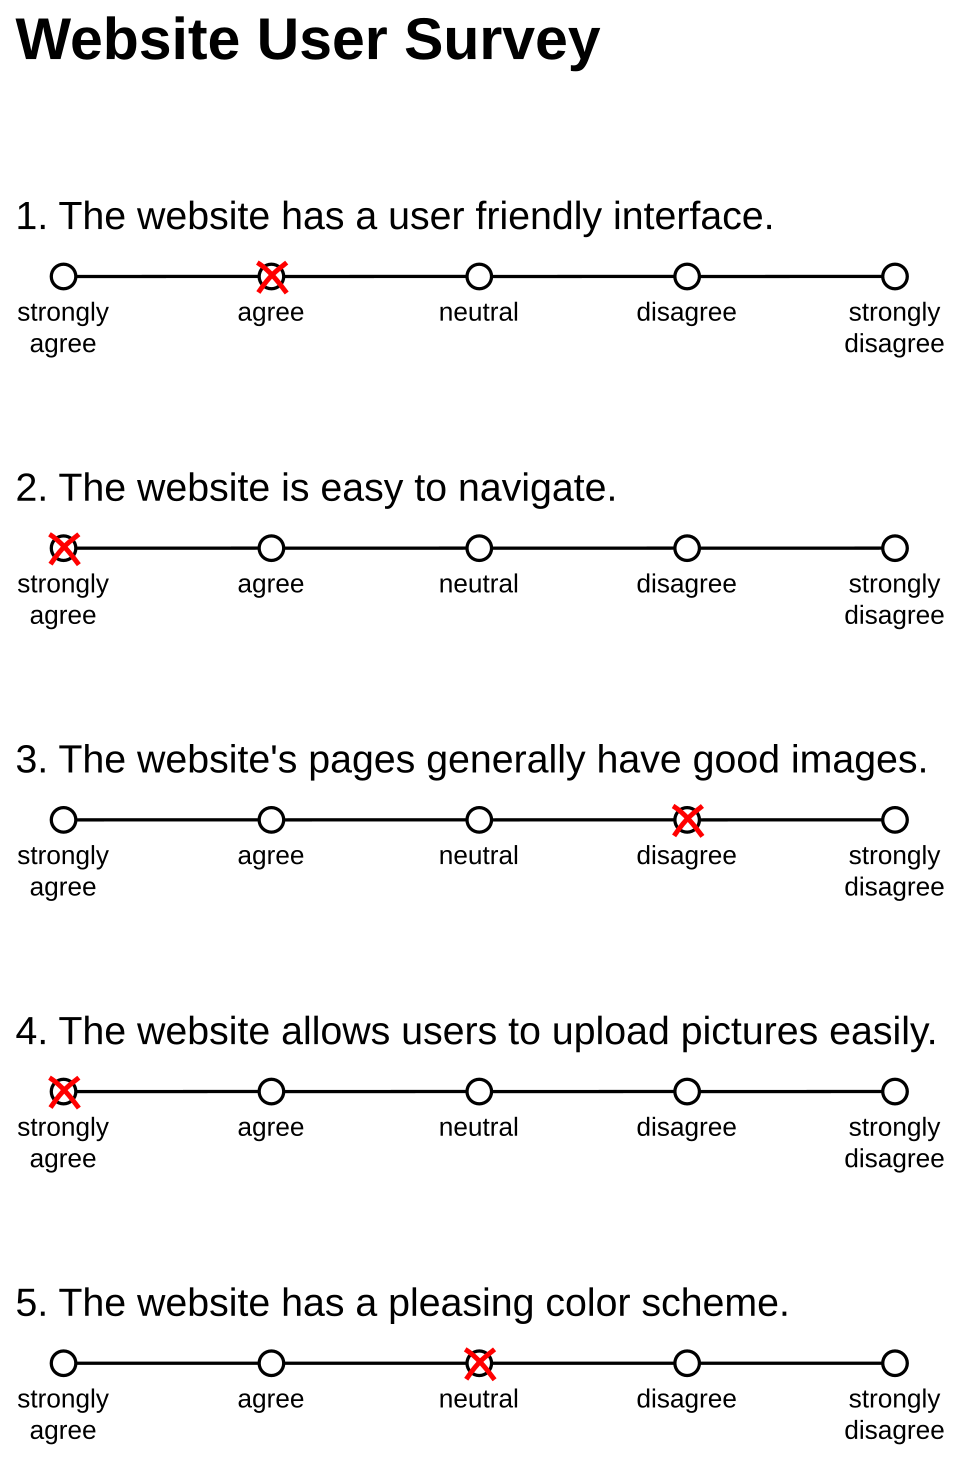 Survey question design (Image: Nicholas Smith vectorization: Own work, CC BY-SA 3.0, via Wikimedia Commons)
F. Findings/Results
- Present data objectively (no interpretation yet).
- Use tables, graphs, and charts (but never raw data dumps).
- Example (NEPSE stock analysis):
"Figure 1 shows a 20% drop in tourist-related stocks (e.g., Himalayan Airlines) during the 2023 fuel crisis, correlating with reduced flight bookings."
G. Discussion
- Interpret findings in light of the literature.
- Explain surprises (e.g., "Contrary to expectations, 70% of eSewa users preferred in-person payments for large transactions.").
- Link to real-world implications (e.g., "This suggests a need for multi-channel payment options in Nepal’s digital economy.").
H. Conclusion & Recommendations
- Summarize key takeaways (1–2 sentences per major finding).
- Provide actionable recommendations (e.g., "NTC should implement dynamic traffic routing apps for tourists.").
- Example (from a Google Travel report):
"Based on 10,000 user reviews, Google Maps should prioritize real-time updates for Nepal’s poorly marked hiking trails to reduce accidents."
I. References
- APA/MLA/Harvard format (check your university’s preference).
- Example (APA):
Nepal Tourism Board. (2023). Annual Tourism Report. Kathmandu: Government of Nepal.
J. Appendices
- Supplementary materials (raw survey questions, interview transcripts, codebooks).
- Example:
"Appendix A: Full questionnaire used for Khalti user study."
3. Formatting and Styling Guidelines
A. Font and Spacing
- Font: Times New Roman (12pt) or Arial (11pt).
- Line spacing: 1.5 or double-spaced.
- Margins: 1-inch (2.5 cm) on all sides.
B. Headings and Subheadings
Use hierarchical headings for readability:
- Level 1: Bold, Title Case (e.g., Methodology)
- Level 2: Italic, Sentence case (e.g., Survey Design)
- Level 3: Bold, lowercase (e.g., sampling technique)
C. Citations and Plagiarism
- Direct quotes must be in quotation marks with page numbers.
"As Smith (2020) argues, ‘tourism satisfaction is directly linked to infrastructure quality’ (p. 45)."
- Paraphrased ideas must still be cited:
"Research indicates that poor road conditions in Nepal’s rural areas deter tourists (NTC, 2022)."
- Plagiarism tools (Turnitin, Grammarly) are mandatory before submission.
4. Common Mistakes to Avoid
| Mistake | Why It’s Bad | How to Fix It |
|---|---|---|
| No clear research question | Report lacks focus. | State the problem in the introduction. |
| Overloading with raw data | Confuses the reader. | Use summarized tables/graphs. |
| Ignoring literature | Work appears isolated from existing research. | Synthesize 5–10 key sources. |
| Poor visuals | Tables/graphs without labels/legends. | Label axes, use captions. |
| Weak conclusion | Recommendations are vague. | Link findings to real-world solutions. |
5. Real-World Applications
A. eSewa: Digital Payment Satisfaction Report
- Idea Used: Customer satisfaction surveys (Likert scale) to measure user experience.
- How It Works:
- eSewa collects post-transaction feedback from 100,000+ users monthly.
- Reports identify pain points (e.g., "40% of users face delays during festive seasons").
- Action: eSewa scales server capacity before Dashain/Tihar.
B. NTC’s Traffic Analysis for Tourists
- Idea Used: Mixed-methods research (GPS data + interviews with drivers).
- How It Works:
- NTC maps congestion hotspots (e.g., Thamel, Durbar Square).
- Reports correlate delays with tourist arrivals (e.g., "Peak season = 30% slower travel times").
- Action: Dynamic traffic routing for tourist buses.
C. Daraz’s Customer Retention Strategy
- Idea Used: Post-purchase surveys to analyze return rates.
- How It Works:
- Daraz sends automated emails asking:
"On a scale of 1–5, how satisfied were you with your delivery experience?"
- Finding: "35% of returns were due to unclear product descriptions."
- Action: Improved images/videos in listings.
- Daraz sends automated emails asking:
6. Worked Example: Analyzing Kathmandu’s Traffic Impact on Tourism
Problem: "How does traffic congestion in Kathmandu affect tourist satisfaction?"
Report Structure Breakdown:
| Section | Content | Real-World Link |
|---|---|---|
| Methodology | Surveyed 200 tourists; GPS data from 50 taxis. | NTC’s traffic databases. |
| Findings | "68% of tourists reported delays >30 mins, leading to missed sightseeing." | IMAGE: heatmap of Kathmandu congestion zones |
| Discussion | "Delays correlate with negative reviews on TripAdvisor." | Example: "‘Wasted half a day stuck in traffic’ – 4.2/5 stars." |
| Recommendation | "NTC should introduce tourist-only lanes during peak hours." | Action: Similar to Barcelona’s ‘Superblocks’. |
7. Ethical Considerations in Reporting
- Transparency: Disclose funding sources (e.g., "Funded by Nepal Tourism Board").
- Objectivity: Avoid bias (e.g., don’t favor one hotel chain over another without data).
- Confidentiality: Protect participant identities (e.g., "All survey responses anonymized").
- Copyright: Use licensed images/data (e.g., "Figure 2: © Google Maps, 2024").
8. Tools to Improve Your Report
| Tool | Purpose | Example Use Case |
|---|---|---|
| LaTeX/Overleaf | Professional formatting (equations, citations). | "For statistical analysis sections." |
| Canva | Designing infographics/tables. | "Visualizing survey results." |
| Zotero/Mendeley | Managing references and avoiding plagiarism. | "Storing 50+ sources for literature review." |
| Grammarly | Checking grammar and clarity. | "Final proofread before submission." |
Exam Tip
How This Unit is Tested
Structural Questions (30%)
- "Describe the components of a research report in order."
- Do: Memorize the 10-section flow (title → abstract → ... → appendices).
- Don’t: Skip any section—examiners check for completeness.
Application Questions (40%)
- "How would you structure a report on ‘WhatsApp’s impact on Nepal’s tourism bookings?’"
- Do:
- Use real examples (e.g., "Methodology: Surveys of 100 hoteliers using WhatsApp for reservations").
- Link to theory (e.g., "This uses a descriptive research design to quantify trends.").
- Don’t: Write generic answers—tie to Nepal’s context.
Critical Analysis (30%)
- "Evaluate the strengths and weaknesses of using social media data in a tourism report."
- Do:
- Strengths: "High sample size (e.g., 50K TripAdvisor reviews)."
- Weaknesses: "Bias—only dissatisfied tourists post reviews."
- Don’t: Ignore ethical or methodological flaws.
Marking Scheme Secrets
- 10 marks for correct structure (lose marks if sections are missing).
- 15 marks for logical flow (e.g., "Findings should directly follow methodology").
- 10 marks for real-world relevance (e.g., "How does this apply to Nepal’s tourism sector?").
- 5 marks for formatting (APA/MLA errors deduct points).
Last-Minute Checklist
✅ Title is specific (not "A Study on Tourism" → "Impact of Traffic on Tourist Satisfaction in Kathmandu"). ✅ Abstract answers what, how, and why in 3 sentences. ✅ Methodology justifies why you chose your methods (e.g., "Surveys over interviews due to cost"). ✅ Visuals are labeled (e.g., "Figure 1: Tourist arrival trends (2020–2024)"). ✅ References are complete (no missing publication years).
Final Note: A well-written research report is 50% structure, 30% data presentation, and 20% storytelling. Practice by rewriting a real report (e.g., NTC’s annual traffic study) in your own words—this trains clarity and conciseness, the two skills examiners reward most.
Based on the TU BTTM syllabus for Research Methodology, unit 10.
Discussion
Loading…