InstrumentationUnit 1010 min read
Instrumentation Applications: Meters, Sensors & Systems
Unit 10 of Instrumentation explores real-world applications of measurement systems, including power factor meters, LVDTs, data acquisition systems (DAS), and industrial instrumentation setups. Learn how these devices work in power systems, automation, and monitoring with practical examples and block diagrams.
TAKEAWAYS:
- Power factor meters measure phase angle between voltage and current in AC circuits using electrodynamometer principles.
- LVDTs (Linear Variable Differential Transformers) convert linear displacement into electrical signals for precise position sensing.
- Data Acquisition Systems (DAS) digitize analog signals for processing, storage, and analysis in industrial and scientific applications.
- Instrumentation systems consist of sensors, signal conditioners, converters, and displays, each playing a critical role in measurement accuracy.
- Applications span power systems, automation, medical diagnostics, and environmental monitoring.
- Exam focus: Working principles, block diagrams, and real-world implementations (e.g., power grids, industrial automation).
1. Power Factor Meters
Power factor () is the ratio of real power () to apparent power () in an AC circuit: where is the phase angle between voltage and current.
1.1 Single-Phase Electrodynamometer Power Factor Meter
Working Principle:
- Uses two coils: a fixed coil (current coil) and a moving coil (voltage coil).
- The moving coil experiences torque due to interaction between magnetic fields of both coils.
- The deflection is proportional to , where and are RMS values of voltage and current, respectively.
Key Expressions:
- Torque on moving coil: where = current through fixed coil, = current through moving coil, = phase angle.
- Deflection angle (): where are constants.
Advantages:
- Measures both magnitude and phase angle.
- High accuracy for lagging and leading power factors.
Disadvantages:
- Bulky and requires calibration.
- Sensitive to external magnetic fields.
1.2 Worked Example: Power Factor in a Factory
A factory motor draws 50 A at 230 V with a lagging power factor of 0.7. Calculate:
- Real power ():
- Apparent power ():
- Reactive power (): Application: Power factor meters help factories optimize energy use by correcting lagging PF (e.g., using capacitors).
2. Linear Variable Differential Transformer (LVDT)
Definition: An LVDT converts linear displacement into an electrical signal using electromagnetic induction. It consists of:
- A primary coil (excited by AC).
- Two secondary coils (symmetrically placed).
- A ferromagnetic core (moves linearly).
Working Principle:
- When the core is at the null position, secondary coils induce equal but opposite voltages ().
- When the core moves, the induced voltages become unequal ().
- The difference voltage () is proportional to displacement.
Mathematical Model: where = sensitivity (V/mm), = displacement.
Applications:
- Direction sensing: sign indicates direction (positive/negative).
- Industrial automation: Position feedback in CNC machines.
- Medical devices: Respiratory monitoring (e.g., measuring chest expansion).
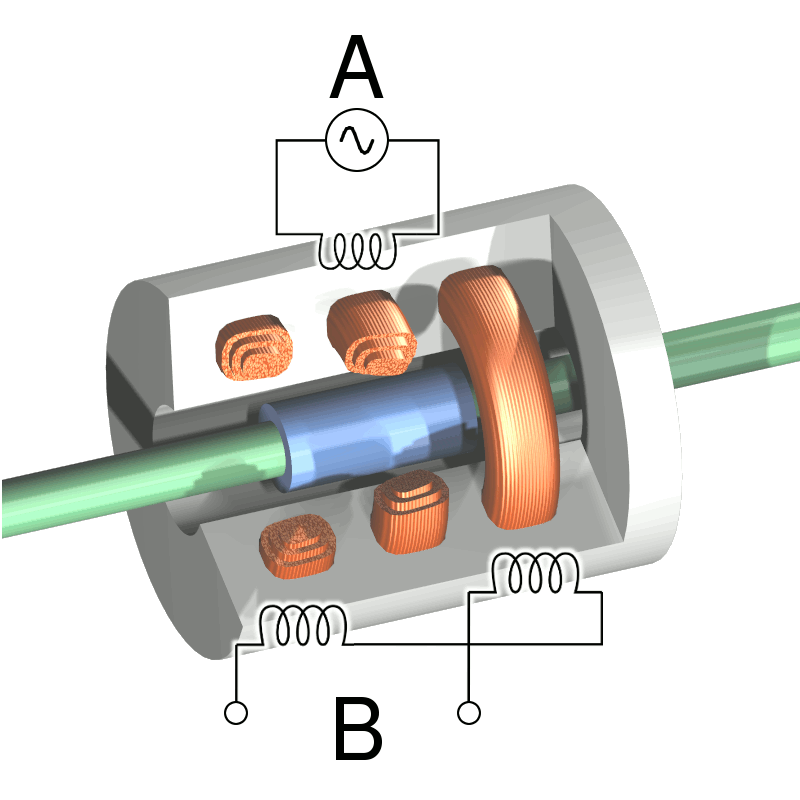 Cross-section showing primary, secondary coils, and movable core with output voltage waveform. (Image: CC BY-SA 3.0, via Wikimedia Commons)
2.1 Worked Example: Hydraulic Cylinder Positioning
An LVDT with sensitivity measures a piston displacement of 5 mm. Calculate:
- Output voltage:
- Direction: If is positive, the piston moves right; if negative, left.
Real-World Tie: Used in Nepal’s hydropower plants to monitor turbine blade positions for efficiency.
3. Data Acquisition Systems (DAS)
Definition: A DAS acquires, converts, and processes analog signals into digital data for analysis. Components:
- Sensors: Convert physical quantities (temperature, pressure) to electrical signals.
- Signal Conditioning: Amplifies/filters signals (e.g., using op-amps).
- ADC (Analog-to-Digital Converter): Converts analog signals to digital (e.g., 8-bit, 12-bit).
- Microcontroller/Computer: Processes and stores data.
- Display/Recording: Outputs results (e.g., LCD, cloud storage).
Block Diagram:
Types of DAS:
| Type | Channels | Applications |
|---|---|---|
| Single-channel DAS | 1 input signal | Lab experiments (e.g., temperature logging) |
| Multi-channel DAS | 4–64+ signals | Industrial automation (e.g., Daraz warehouse inventory) |
| Wireless DAS | Bluetooth/Wi-Fi | Remote monitoring (e.g., NTC power grid) |
3.1 Worked Example: Traffic Monitoring in Kathmandu
A DAS measures vehicle speed using an inductive loop sensor (buried in the road). Steps:
- Sensor: Detects metal vehicles via inductance change.
- Signal Conditioning: Amplifies the weak signal.
- ADC: Converts to digital (e.g., 10-bit resolution).
- Processing: Calculates speed using time-of-flight.
- Output: Displays on a traffic management dashboard (used by Kathmandu Metropolitan City).
Real-World Tie: Pathao’s ride-hailing app uses DAS-like systems to track driver locations via GPS sensors and process data in real time.
4. Instrumentation System Components
An instrumentation system integrates sensors, signal processing, and output devices. Key components:
| Component | Function | Example |
|---|---|---|
| Sensor | Detects physical quantity (e.g., temperature) | Thermocouple, LVDT |
| Signal Conditioner | Amplifies/filters signals | Operational amplifier (op-amp) |
| ADC | Converts analog → digital | 12-bit ADC (e.g., in Arduino) |
| Microcontroller | Processes data | Raspberry Pi, STM32 |
| Display | Shows results | LCD, LED, cloud dashboard |
| Recorder | Stores data for analysis | SD card, database |
4.1 Worked Example: NEPSE Stock Market Monitoring
NEPSE tracks stock prices using:
- Sensors: Optical scanners read trading slips.
- Signal Conditioning: Filters noise from scanner data.
- ADC: Converts price signals to digital (e.g., 16-bit for precision).
- Processing: Calculates indices (e.g., NEPSE Index) via algorithms.
- Display: Broadcasts live on NEPSE’s website and mobile apps.
5. Applications of Instrumentation
| Field | Application | Example |
|---|---|---|
| Power Systems | Power factor correction, energy monitoring | NTC grid management |
| Automation | Process control in factories | Daraz warehouse robotics |
| Medical | Patient monitoring (ECG, blood pressure) | Hospitals (e.g., CIMS Hospital) |
| Environmental | Pollution monitoring (CO₂, NO₂ levels) | Department of Environment, Nepal |
| Transportation | Traffic control, vehicle diagnostics | Pathao, NTC’s railway signaling |
In the Real World
eSewa & Khalti (Digital Payments)
- Application: Load monitoring in data centers.
- How: Servers use temperature sensors (RTDs) and current sensors (CTs) to ensure stable operations. If a server overheats, the system triggers alerts via DAS.
Daraz (E-Commerce Logistics)
- Application: Inventory tracking in warehouses.
- How: LVDTs measure conveyor belt positions to sort packages. Weight sensors (load cells) verify order accuracy before shipment.
Ncell (Telecom Infrastructure)
- Application: Cell tower monitoring.
- How: Power factor meters ensure efficient energy use in base stations. DAS logs signal strength to optimize network coverage.
Exam Tip
Power Factor Meters:
- Always derive torque and deflection equations.
- Mention electrodynamometer principle and phase angle ().
- Exam trick: For lagging/leading PF, state whether current lags/leads voltage.
LVDT:
- Explain null position and output voltage polarity for direction.
- Relate to linear displacement applications (e.g., hydraulic systems).
DAS:
- Draw the block diagram (sensor → conditioner → ADC → MCU).
- Compare single-channel vs. multi-channel systems.
Instrumentation Systems:
- List 5 components and their roles.
- Give one real-world example (e.g., NEPSE, NTC).
Worked Examples:
- Always show calculations (e.g., PF, LVDT output).
- Link to Nepali contexts (e.g., hydropower, traffic, e-commerce).
Visual Summary:
Based on the PU BE Computer (PU) syllabus for Instrumentation, unit 10.
Discussion
Loading…