InstrumentationUnit 910 min read
Display & Recording Devices: Types, Working, Applications
Unit 9 of Instrumentation explores analog/digital displays (LED, LCD, CRT), recorders (pen, strip-chart, digital), and storage devices (magnetic tapes, solid-state), their working principles, error sources, and real-world uses in medical, industrial, and data-logging systems.
Core Concepts
1. Classification of Display and Recording Devices
Display and recording devices are categorized based on their output medium (visual, audio, or digital), speed (real-time vs. delayed), and storage capability. The primary classifications are:
A. Display Devices
Convert processed signals into human-readable formats (visual, audio, or tactile). Key types:
- Analog Displays: Use continuous signals (e.g., needle-based meters, CRT monitors).
- Digital Displays: Show discrete values (e.g., LED/LCD screens, 7-segment displays).
- Graphic Displays: Plot data trends (e.g., oscilloscope traces, plotters).
B. Recording Devices
Store data for future analysis or playback. Key types:
- Analog Recorders: Use physical media (e.g., pen recorders, strip-chart recorders).
- Digital Recorders: Store data electronically (e.g., data loggers, solid-state drives).
- Hybrid Systems: Combine analog and digital (e.g., digital oscilloscopes with USB storage).
2. Analog Display Devices
A. Moving-Coil and Moving-Iron Meters
- Working Principle:
- Moving-coil (PMMC): Current flows through a coil in a magnetic field, causing torque proportional to input.
- Moving-iron: A soft iron piece is attracted/repelled by a fixed coil, deflecting a pointer.
- Applications:
- PMMC: Used in ammeters/voltmeters (high accuracy, DC only).
- Moving-iron: Used in energy meters (AC/DC, rugged).
- Limitations:
- PMMC: Fails in AC due to eddy currents.
- Moving-iron: Non-linear scale, less precise.
B. Cathode Ray Tube (CRT) Displays
- Working Principle:
- Electron beam deflected by X-Y plates (controlled by input signals) strikes a phosphorescent screen, creating a visual trace.
- Applications:
- Oscilloscopes: Real-time signal visualization (e.g., Tektronix oscilloscopes in labs).
- Old TVs: Raster scan displays.
- Limitations:
- Bulky, high power consumption, flicker in low refresh rates.
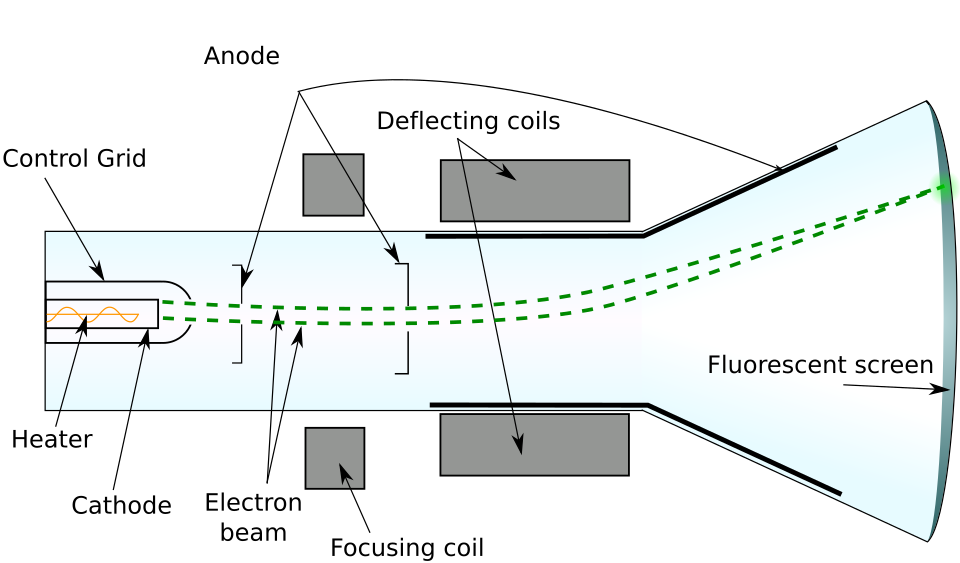 Cross-section of a CRT showing electron gun, deflection plates, and phosphor screen (Image: Vector:Interiot, Raster:Theresa Knott, CC BY-SA 3.0, via Wikimedia Commons)
3. Digital Display Devices
A. LED and LCD Displays
LED (Light Emitting Diode):
- Working: Semiconductor emits light when current passes through.
- Types:
- 7-segment: Displays digits (0–9) (used in digital clocks, multimeters).
- Matrix: Forms characters/pixels (used in traffic signals, Khalti OTP screens).
- Advantages: Low power, fast response, durable.
- Limitations: Limited viewing angle (unless transparent LEDs).
LCD (Liquid Crystal Display):
- Working: Liquid crystals align/block light via backlight + polarizers.
- Types:
- TN (Twisted Nematic): Cheap, used in calculators.
- IPS (In-Plane Switching): Wide viewing angles (used in smartphones, laptops).
- Advantages: Thin, low power, high resolution.
- Limitations: Requires backlight, slower response than OLED.
B. Comparison Table: LED vs. LCD vs. OLED
| Feature | LED (7-segment) | LCD | OLED |
|---|---|---|---|
| Technology | Semiconductor light | Liquid crystals + backlight | Organic light-emitting diodes |
| Power Use | Low | Moderate (backlight) | Very low (self-emissive) |
| Viewing Angle | Limited (unless transparent) | Good (IPS) | Excellent (360°) |
| Response Time | Microseconds | 5–100ms | <1ms |
| Cost | Low | Moderate | High |
| Example Use | Digital clocks, multimeters | Laptops, TVs | Smartphone screens (e.g., Samsung Galaxy) |
4. Recording Devices
A. Analog Recorders
Pen Recorders:
- Working: A pen traces signals on moving paper (driven by a motor).
- Types:
- Strip-chart: Single pen, linear motion (used in medical ECG machines).
- Multi-pen: Multiple pens for different channels (used in industrial process monitoring).
- Limitations: Paper wear, drift over time, not reusable.
Magnetic Tape Recorders:
- Working: Signals magnetize ferric oxide-coated tape via a write head; playback uses a read head.
- Applications: Old audio recorders, VCRs, data backups (e.g., Nepal Rastra Bank’s archival systems).
- Limitations: Degradation over time, mechanical wear.
B. Digital Recorders
Data Loggers:
- Working: Microcontroller + ADC samples signals, stores in EEPROM/Flash.
- Applications:
- Environmental monitoring: Temperature/humidity loggers (e.g., Nepal’s weather stations).
- Medical: Patient vital signs (e.g., ECG data loggers).
- Advantages: Reusable, long-term storage, remote access.
Solid-State Recorders:
- Working: Uses flash memory (e.g., USB drives, SD cards) or SSDs.
- Applications:
- Oscilloscope data storage (e.g., Rigol DS1000 series).
- CCTV systems (e.g., NTC’s traffic monitoring).
5. Hybrid and Advanced Systems
A. Digital Storage Oscilloscopes (DSO)
- Working: Combines ADC + PC screen for real-time waveform capture and storage.
- Example: Tektronix MDO3000 (used in PU labs for signal analysis).
- Advantages: Waveform math, autosave, USB export.
B. Plotters
- Working: Mechanical arm draws graphs on paper (used in CAD systems, engineering drawings).
- Types:
- Flatbed: Large-format printing (e.g., architectural plans).
- Drum: Rolls paper past a pen (e.g., old CAD plotters).
In the Real World
eSewa and Khalti Transactions
- Digital Display: Every transaction on eSewa/Khalti apps uses an LCD/OLED screen to show real-time balances, QR codes, and OTPs.
- Data Logging: Banks log every transaction in digital databases (solid-state storage) for audits.
Pathao’s Ride Tracking
- Real-time Display: The driver’s app shows GPS coordinates on an LCD screen (updated via ADC from GPS signals).
- Recording: Ride history is stored in cloud databases (digital recording) for dispute resolution.
NTC’s Traffic Monitoring
- Analog Recording: Old strip-chart recorders logged traffic flow at busy intersections (e.g., Kathmandu Ring Road).
- Digital Shift: Now uses CCTV + data loggers to store video/audio for AI-based traffic analysis.
Nepal Electricity Authority (NEA) Grid Monitoring
- CRT Oscilloscopes: Used in substations to monitor voltage/current waveforms in real-time.
- Digital Loggers: Record power fluctuations for fault diagnosis.
Worked Example: ECG Machine Display
Scenario: A patient’s heart rate is measured using an ECG machine with an LCD display and a pen recorder.
- Signal Path:
- Electrodes → Amplifier → ADC (if digital) → Display/Recorder.
- Analog Display (Pen Recorder):
- Paper speed: 25 mm/s (standard for ECG).
- Heart rate calculation:
- 1 large square (5 mm) = 0.2 s.
- If R-R interval = 4 large squares, then:
- Digital Display (LCD):
- Shows numerical BPM (e.g., 75 bpm) alongside a graphic trace.
Exam Tip
What Examiners Look For
- Definitions:
- Differentiate between display (real-time) and recording (storage) devices.
- Know ADC vs. DAC roles in digital systems.
- Working Principles:
- Explain how a CRT works (electron beam deflection).
- Describe LCD backlight + polarizer mechanism.
- Applications:
- Link pen recorders to medical/industrial use.
- Relate digital loggers to environmental monitoring.
- Comparisons:
- LED vs. LCD vs. OLED (power, angle, cost).
- Analog vs. digital recorders (accuracy, storage).
- Calculations:
- Heart rate from ECG trace (square method).
- Resolution of a digital display (bits per pixel).
Common Mistakes to Avoid
- Confusing displays with recorders: A CRT is a display, not a recorder.
- Ignoring units: Always specify mm/s for chart speed, Hz for sampling rate.
- Overlooking hybrid systems: Modern devices (e.g., DSO) combine analog and digital.
Key Formulas to Memorize
Sampling Rate (Nyquist): (Where = sampling frequency, = highest signal frequency.)
Resolution of Digital Display: (Where = voltage per least significant bit.)
Chart Speed Calculation: (Example: 25 mm/s ÷ 5 mm/division = 5 ms/division.)
Based on the PU BE Computer (PU) syllabus for Instrumentation, unit 9.
Discussion
Loading…