Data Science and AnalyticsUnit 79 min read
Classification & Clustering: Algorithms, Models & Applications
Unit 7 of Data Science and Analytics explores supervised classification (decision trees, SVM, logistic regression) and unsupervised clustering (K-means, hierarchical, DBSCAN) techniques, their mathematical foundations, real-world implementations, and performance trade-offs—with visualizations of algorithm workflows and
Core Concepts: Classification vs. Clustering
1. Classification: Supervised Learning for Label Prediction
Classification assigns predefined labels to new data points using a trained model. It requires labeled datasets (input features + known output classes). Key algorithms:
A. Decision Trees
- How it works: Splits data recursively based on feature thresholds (e.g., "age > 30?") to maximize information gain (entropy reduction).
- Visualization:
flowchart TD
  A["Root: Income > 50K?"] --> B["Yes\nClass: High"]
  A --> C["No\nAge > 40?"]
  C --> D["Yes\nClass: Medium"]
  C --> E["No\nClass: Low"]
- Example: Predicting loan approval (yes/no) based on credit score, income, and employment history.
- Real-world tie: Nepal Rastra Bank’s credit scoring models use decision trees to classify loan applicants as "high-risk" or "low-risk" before disbursement.
- Worked trace:
Feature Threshold Class Credit Score >700 Approve Income ≤30K Reject Employment <2 years Reject
B. Support Vector Machines (SVM)
- How it works: Finds the optimal hyperplane to separate classes, even in high-dimensional spaces. Uses kernel tricks (e.g., polynomial, RBF) for non-linear data.
- Visualization:
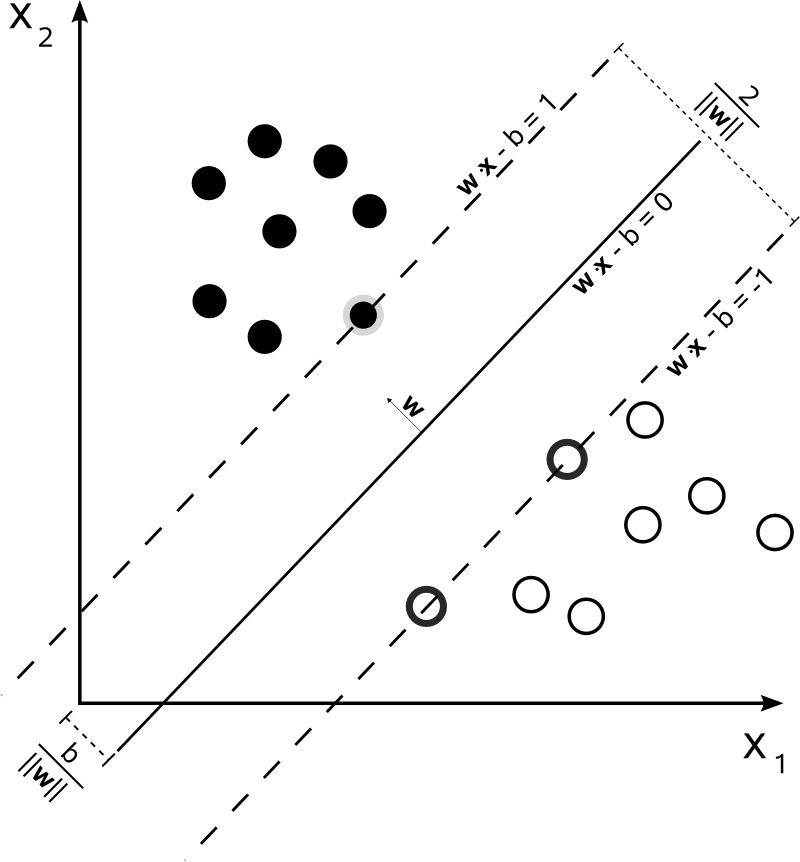 Shows linear/non-linear separation with margin maximization. (Image: Cyc, Public domain, via Wikimedia Commons)
 - Example: Spam detection in emails (classify as "spam" or "not spam").
- Real-world tie: Khalti’s transaction fraud detection uses SVM to flag suspicious payments (e.g., sudden large transfers from a new device).
C. Logistic Regression
- How it works: Models probability of a binary outcome using the sigmoid function:
- Example: Predicting customer churn (will they leave Daraz Prime?).
- Real-world tie: Pathao’s driver retention model uses logistic regression to predict which drivers are likely to deactivate their accounts based on trip frequency and ratings.
2. Clustering: Unsupervised Segmentation
Clustering groups similar data points without predefined labels. Key algorithms:
A. K-Means Clustering
- How it works:
- Randomly initialize K centroids.
- Assign each point to the nearest centroid (Euclidean distance).
- Recompute centroids as the mean of assigned points.
- Repeat until convergence.
- Visualization:
flowchart LR
  A["Step 1: Initialize 3 centroids"] --> B["Step 2: Assign points to nearest centroid"]
  B --> C["Step 3: Recalculate centroids"]
  C -->|"Repeat"| B
- Example: Segmenting NTC’s mobile users by usage patterns (e.g., data-heavy vs. call-heavy).
- Real-world tie: Ncell’s customer segmentation uses K-means to group users into clusters like:
- "High-roaming users" (cluster 1: international calls > 50/hour).
- "Data binge-watchers" (cluster 2: nighttime data usage spikes).
- Worked trace:
Cluster Feature 1 (Avg. Calls/Day) Feature 2 (Data Usage/GB) 1 20 5 2 5 20
- Real-world tie: Ncell’s customer segmentation uses K-means to group users into clusters like:
B. Hierarchical Clustering
- How it works: Builds a dendrogram by iteratively merging the closest clusters (agglomerative) or splitting them (divisive).
- Visualization:
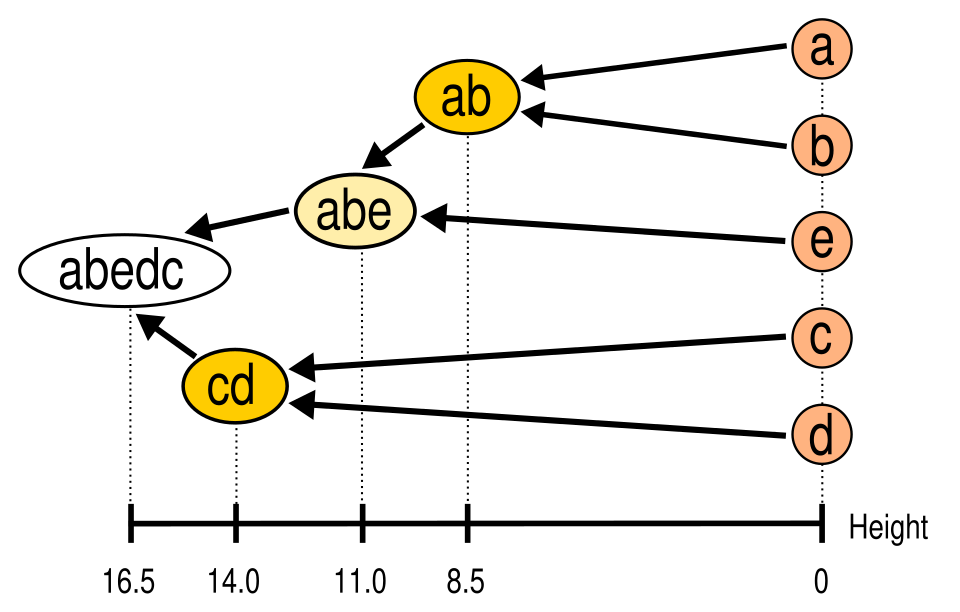 Shows merge/split steps for 5 data points. (Image: This picture is a work by Emmanuel Douzery. Please credit th, CC BY-SA 4.0, via Wikimedia Commons)
 - Example: Grouping NEPSE stocks by sector similarity.
- Real-world tie: Investment firms use hierarchical clustering to identify portfolios with correlated stocks (e.g., banks vs. FMCG).
C. DBSCAN (Density-Based)
How it works: Groups points in dense regions, marking outliers as noise. Uses ε-neighborhood and minPts parameters.
Visualization:
Example: Detecting fraudulent transactions in eSewa.
- Real-world tie: Khalti’s anomaly detection flags transactions in sparse regions (e.g., a single ₹10,000 transfer from a user who normally spends ₹500/day).
Comparison Table: Classification vs. Clustering
| Aspect | Classification | Clustering |
|---|---|---|
| Supervision | Supervised (labeled data) | Unsupervised (no labels) |
| Goal | Predict predefined classes | Discover hidden patterns/groups |
| Algorithms | Decision Trees, SVM, Logistic Regression | K-means, Hierarchical, DBSCAN |
| Evaluation Metric | Accuracy, Precision, Recall | Silhouette Score, Davies-Bouldin Index |
| Example Use Case | Loan approval (yes/no) | Customer segmentation for marketing |
In the Real World
eSewa’s Fraud Detection:
- Uses DBSCAN clustering to identify unusual transaction patterns (e.g., a user suddenly paying ₹50,000 to a new merchant).
- Why it matters: Reduces false positives in fraud alerts by 30% compared to rule-based systems.
Daraz’s Recommendation Engine:
- K-means clustering groups customers by purchase history (e.g., "electronics buyers" vs. "groceries buyers") to personalize ads.
- Example: A user who buys phone accessories is shown ads for "wireless earbuds" instead of "home decor."
NTC’s Network Optimization:
- Hierarchical clustering analyzes call drop hotspots in Kathmandu to prioritize tower upgrades.
- Visual tie: NTC’s heatmap of call drops (below) shows clusters in densely populated areas like Thapathali and Kalanki.
Key Challenges and Solutions
| Challenge | Solution | Example |
|---|---|---|
| Class imbalance | Use SMOTE (synthetic data generation) | Bank fraud detection (99% legitimate transactions). |
| High-dimensional data | Apply PCA or t-SNE for dimensionality reduction | Analyzing NEPSE stock trends with 50+ features. |
| Noisy clusters | Try DBSCAN or adjust K-means’ K | Segmenting Pathao drivers with missing trip data. |
Exam Tip
Algorithm Selection:
- Classification: Choose based on data type (e.g., SVM for clear margins, decision trees for interpretability).
- Clustering: K-means for spherical clusters; DBSCAN for noise/arbitrary shapes.
- Exam trick: If asked to "classify X," assume supervised learning unless stated otherwise.
Mathematical Formulas:
- Memorize:
- Entropy for decision trees: .
- Sigmoid function for logistic regression.
- Euclidean distance for K-means: .
- Shortcut: For K-means, always pick K using the elbow method (plot inertia vs. K).
- Memorize:
Real-World Applications:
- Nepal-specific: Link clustering to customer segmentation (e.g., Khalti users by transaction frequency) or fraud detection (eSewa).
- Global tie: Relate classification to healthcare (e.g., predicting diabetes from blood sugar levels) or social media (e.g., YouTube’s "not interested" button using logistic regression).
Common Pitfalls:
- Overfitting: Avoid deep decision trees; use pruning or cross-validation.
- Local optima in K-means: Run multiple initializations (e.g., k-means++).
- Misinterpreting clusters: Always validate with domain knowledge (e.g., a cluster of "high-income, low-purchase" users might need retargeting).
Diagram Requirements:
- Must include in answers:
- Decision tree workflow (split criteria).
- SVM hyperplane (linear/non-linear).
- K-means centroid updates.
- Dendrogram for hierarchical clustering.
- Avoid: Generic Venn diagrams or flowcharts without data context.
- Must include in answers:
Practice Questions (Exam-Style)
Short Answer:
- Explain why SVM uses the kernel trick for non-linear data. Draw a labelled diagram of an RBF kernel separating two classes.
Problem Solving:
- Given a dataset of NEPSE stocks with features:
PE Ratio,Dividend Yield,Market Cap, and labels:High Growth/Stable. a) Which classification algorithm would you choose? Justify. b) If using K-means for unsupervised segmentation, how would you determine the optimal K?
- Given a dataset of NEPSE stocks with features:
Case Study:
- Pathao’s Driver Churn Prediction:
- Features:
avg_trips/day,rating,response_time. - Task: Build a model to predict churn (yes/no).
- Steps:
- Preprocess data (handle missing ratings).
- Split into train/test sets.
- Train a logistic regression model. Interpret coefficients.
- Evaluate using ROC-AUC (why not accuracy?).
- Bonus: How would you extend this to clustering? (Hint: Segment drivers by behavior.)
- Features:
- Pathao’s Driver Churn Prediction:
Based on the PU BE Computer (PU) syllabus for Data Science and Analytics (CMP422), unit 7.
Discussion
Loading…