StatisticsUnit 46 min read
Measures of Dispersion – Range, Variance, Standard Deviation, IQR
Unit 4 of Statistics: introduces key dispersion measures, explains their calculation, compares their strengths and weaknesses, and demonstrates practical use in hotel management data.
Key points
- Dispersion quantifies spread of data beyond central tendency.
- Range is simple but sensitive to outliers.
- Variance and Standard Deviation are squared‑error based and widely used.
- Inter‑Quartile Range (IQR) captures middle‑half spread, robust to extremes.
- Choosing a dispersion metric depends on data type, outlier presence, and analysis goal.
Measures of Dispersion
Dispersion measures describe how data values spread around a central point. In hotel management, they help assess variability in room rates, occupancy, revenue, and guest satisfaction scores.
1. Range
The range is the simplest dispersion metric:
It uses only the extreme values, so it is easy to compute but can be misleading if outliers exist.
Worked Example – Room Rates
Suppose a hotel records the following nightly rates (in NPR) for a week:
| Day | Rate |
|---|---|
| Mon | 8,000 |
| Tue | 7,500 |
| Wed | 9,200 |
| Thu | 8,500 |
| Fri | 10,000 |
| Sat | 7,800 |
| Sun | 9,500 |
Range NPR.
Figure: Bar chart of weekly room rates
The range tells us the spread is 2,500 NPR, but it ignores the distribution of the middle values.
2. Variance and Standard Deviation
Variance measures average squared deviation from the mean. Standard deviation is its square root, giving a dispersion metric in the same units as the data.
The denominator (Bessel’s correction) provides an unbiased estimate for a sample.
Worked Example – Same Room Rates
- Compute mean:
- Compute squared deviations:
| Day | Rate | Deviation | Squared Deviation |
|---|---|---|---|
| Mon | 8,000 | -500 | 250,000 |
| Tue | 7,500 | -1,000 | 1,000,000 |
| Wed | 9,200 | +700 | 490,000 |
| Thu | 8,500 | 0 | 0 |
| Fri | 10,000 | +1,500 | 2,250,000 |
| Sat | 7,800 | -700 | 490,000 |
| Sun | 9,500 | +1,000 | 1,000,000 |
Sum of squared deviations .
- Variance:
- Standard deviation:
Figure: Histogram of room rates with mean and standard deviation
The standard deviation of ~956 NPR indicates typical deviation from the mean rate.
3. Inter‑Quartile Range (IQR)
IQR captures the spread of the middle 50 % of data, making it robust to outliers.
Where is the 25th percentile and is the 75th percentile.
Worked Example – Guest Satisfaction Scores
Assume a hotel collects guest satisfaction scores (1–5) from 15 guests:
- Order the data (already ordered).
- is the 4th value (since , at position ): .
- is the 12th value: .
- IQR .
Figure: Box plot of guest satisfaction scores
The IQR of 2 shows that the middle 50 % of scores lie within a range of 2 points, unaffected by the two extreme 1s.
4. Comparison of Dispersion Measures
| Measure | Formula | Units | Sensitivity to Outliers | Typical Use |
|---|---|---|---|---|
| Range | Same as data | High | Quick check, small data | |
| Variance | Squared units | High | Statistical inference, ANOVA | |
| Standard Deviation | Same as data | High | Reporting, control charts | |
| IQR | Same as data | Low | Outlier detection, robust stats |
Mermaid diagram: Decision flow for choosing a dispersion metric
flowchart TD
  A["Data size"] --> B{"Large sample?"}
  B -->|"Yes"| C["Use SD for inference"]
  B -->|"No"| D["Check for outliers"]
  D -->|"Outliers present"| E["Use IQR"]
  D -->|"No outliers"| F["Use Range or SD"]
5. Advantages and Disadvantages
| Metric | Advantages | Disadvantages |
|---|---|---|
| Range | Simple, quick | Ignores most data, extreme outliers dominate |
| Variance | Mathematically convenient, additive | Units squared, hard to interpret |
| Standard Deviation | Same units as data, widely understood | Sensitive to outliers |
| IQR | Robust to outliers, useful for box plots | Requires sorting, less intuitive for small samples |
6. Applications in Hotel Management
| Application | Metric | Why |
|---|---|---|
| Pricing strategy | Standard Deviation of room rates | Identify price volatility |
| Revenue forecasting | Variance of daily revenue | Estimate uncertainty |
| Service quality | IQR of guest satisfaction | Detect consistent service levels |
| Occupancy analysis | Range of occupancy percentages | Quick check for extreme low/high days |
7. In the real world
eSewa – Transaction Amounts
eSewa monitors daily transaction amounts. The standard deviation of transaction values is used to set fraud detection thresholds; a sudden spike beyond 3 SD indicates potential fraud.Daraz – Delivery Time
Daraz calculates the IQR of delivery times for each city. A narrow IQR signals reliable delivery, while a wide IQR prompts investigation into logistics bottlenecks.Ncell – Network Latency
Ncell measures variance of packet latency across its network. High variance triggers network optimization, ensuring consistent user experience.
8. Exam tip
- Understand definitions: Know the formulas for range, variance, standard deviation, and IQR.
- Practice calculations: Work through at least two full examples (one with mean/SD, one with IQR).
- Interpret results: Be ready to explain what a high or low dispersion value implies in a hotel context.
- Compare metrics: When asked to choose a dispersion measure, justify your choice based on data characteristics (size, outliers).
- Use tables: Summarize key differences in a concise table; this often earns partial marks.
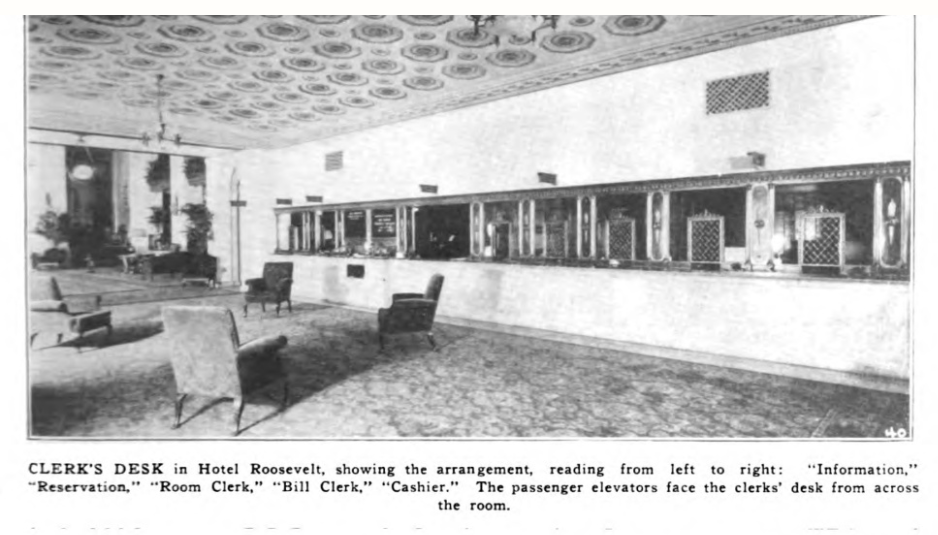 Front desk where reservations are taken (Image: Architect: George B. Post & Son, Public domain, via Wikimedia Commons)
 Standard guest room used for data collection (Image: Jumpy542, CC0, via Wikimedia Commons)
Based on the TU BHM syllabus for Statistics (STT311), unit 4.
Discussion
Loading…