Operations ManagementUnit 67 min read
Capacity & Location Planning: Models, Trade-offs & Strategic Decisions
Unit 6 of Operations Management explores how businesses determine optimal production capacity (short-term vs. long-term) and choose locations that balance costs, demand, and logistics—using quantitative models, break-even analysis, and real-world case studies like Daraz warehouses or Ncell tower placement.
Core Concepts: Capacity Planning
Capacity planning ensures an organization’s resources (labor, machines, space) meet demand without over- or under-investment. It spans short-term (daily scheduling), medium-term (seasonal adjustments), and long-term (facility expansion).
1. Types of Capacity
mindmap
  root((Capacity Types))
    Short-term
      "Daily/Weekly adjustments (e.g., Ncell call-center staffing)"
    Medium-term
      "Seasonal demand (e.g., Daraz delivery trucks during Dashain)"
    Long-term
      "Facility expansion (e.g., Nabil Bank’s new ATMs in Kathmandu)"
2. Capacity Utilization & Efficiency
- Utilization Rate = (Actual Output / Best Operating Level) × 100% Example: If a factory runs at 75% capacity (producing 750 units/day vs. max 1000), it has 25% slack—useful for demand spikes but risky if demand drops.
- Efficiency = (Actual Output / Theoretical Capacity) × 100% Example: A Daraz warehouse with 100 workers packing 800 orders/day vs. theoretical max of 1200 orders/day → 66.7% efficiency.
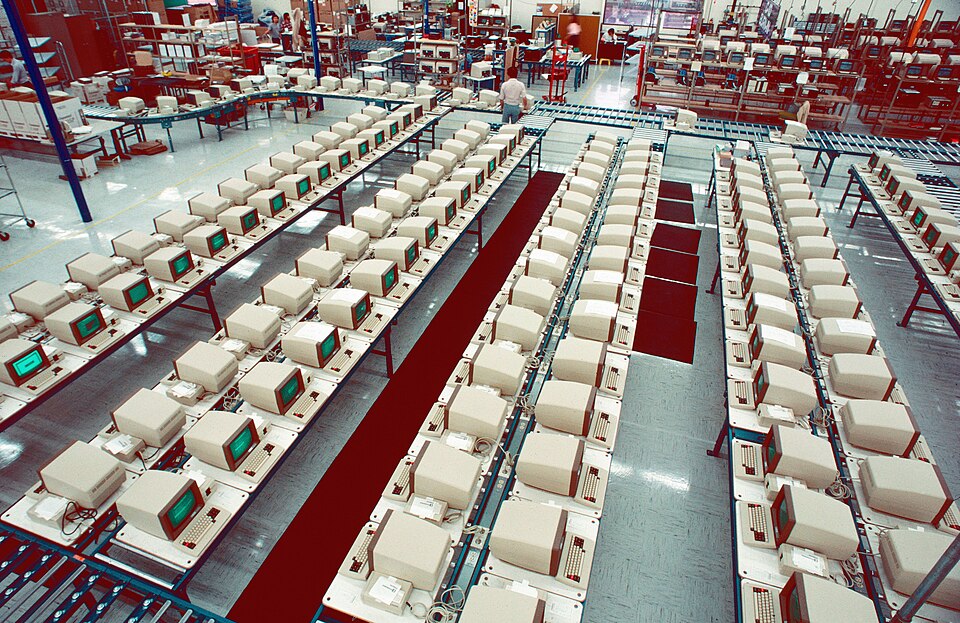 Labelled diagram showing bottleneck (conveyor belt slowdown) and buffer storage. (Image: Cromemco, CC BY-SA 3.0, via Wikimedia Commons)
3. Capacity Planning Models
| Model | When to Use | Formula/Key Idea | Example |
|---|---|---|---|
| Break-even Analysis | Compare fixed vs. variable costs. | Nabil Bank’s loan processing: Break-even at 500 loans/month if fixed costs = Rs. 2M and variable cost = Rs. 3000/loan. | |
| Learning Curve | Labor-intensive processes (e.g., sewing). | Time/cost per unit decreases by % with repetition. | Himalayan Java’s tea-picking: 1st day = 10 kg/person; 10th day = 15 kg/person (20% improvement). |
| Waiting Line (Queueing) | Service operations (e.g., NTC call centers). | (Little’s Law: Avg. customers in queue = arrival rate × avg. wait time). | Pathao drivers: If 100 requests/hour and avg. wait = 5 mins, queue length = 83 drivers. |
WORKED EXAMPLE: Daraz’s Warehouse Capacity Daraz’s Pokhara warehouse has:
- Fixed Costs: Rs. 5M/year (rent, salaries).
- Variable Cost: Rs. 200/order.
- Price: Rs. 1500/order. Question: How many orders must Daraz process to break even? Solution: Interpretation: Daraz must sell ≥3,846 orders/month to cover costs. If they sell 5,000 orders, profit = Rs. 6.2M/year.
Location Planning: Strategic Trade-offs
Location decisions impact costs (land, labor), demand (proximity to customers), and logistics (transportation, regulations).
1. Factors Influencing Location
flowchart TD
  A["Location Decision Factors"] --> B["Costs"]
  A --> C["Demand"]
  A --> D["Infrastructure"]
  A --> E["Government Policies"]
  A --> F["Competitors"]
  B --> B1["Land/rent (e.g., Kathmandu vs. Pokhara)"]
  B --> B2["Labor wages (e.g., Chitwan vs. Dharan)"]
  C --> C1["Market access (e.g., Daraz’s Kathmandu hub for urban demand)"]
  D --> D1["Transport links (e.g., NTC’s road vs. air routes)"]
  E --> E1["Tax incentives (e.g., Bhairahawa SEZ for manufacturing)"]
  F --> F1["Competitor clustering (e.g., Thamel for IT firms)"]
2. Location Models
| Model | Best For | Key Variables | Nepali Example |
|---|---|---|---|
| Factor Rating Method | Qualitative trade-offs (e.g., schools). | Weighted scores for factors (cost, labor, etc.). | NTC choosing a new substation site: Scores Kathmandu (8/10 for demand), Pokhara (7/10 for cost). |
| Center of Gravity | Minimize transport costs (e.g., warehouses). | Daraz’s distribution center: Balances orders from Kathmandu (50%), Pokhara (30%), Biratnagar (20%). | |
| Transportation Model | Optimize shipping routes. | Minimize total transport cost. | Nabil Bank’s ATM supply chain: 3 depots → 10 branches. |
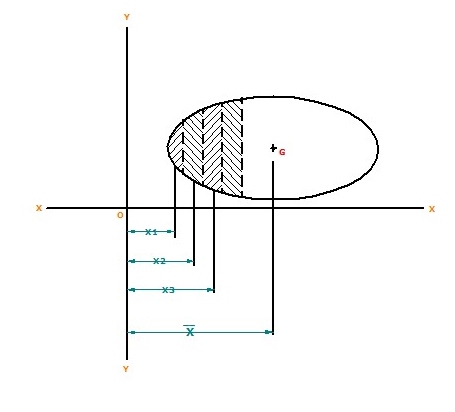 Showing demand points (Kathmandu, Pokhara) and optimal warehouse location. (Image: Nithinhegde.mb, CC BY-SA 4.0, via Wikimedia Commons)
3. Location Strategies
- Single Location: Low risk, high fixed costs (e.g., Nepal Rastra Bank’s central office in Kathmandu).
- Multiple Locations: Higher flexibility (e.g., Ncell’s regional call centers in Dharan, Biratnagar, and Pokhara).
- Global Sourcing: Offshore manufacturing (e.g., Himalayan Java’s tea processing in India).
CASE STUDY: Toyota’s Nepal Plant (Bhairahawa)
- Capacity: 5,000 cars/year (2023).
- Location Factors:
- Proximity to raw materials (steel from India, local labor).
- Government incentives (SEZ tax breaks).
- Demand: 80% of Nepali car buyers live within 300 km.
- Challenge: Seasonal demand (sales drop 30% in monsoon).
- Solution: Aggregate planning (adjust production + inventory).
In the Real World
eSewa’s Server Capacity
- Idea: Break-even analysis for server farms.
- How: eSewa’s data centers must handle 50,000 transactions/hour during Dashain. They use load balancing (distributing traffic across servers) to avoid overcapacity costs. If a server costs Rs. 2M/year and handles 10,000 transactions/hour, they need 5 servers to break even at peak demand.
Pathao’s Driver Location
- Idea: Center of Gravity Model.
- How: Pathao’s algorithm places drivers in high-demand zones (e.g., Thamel, Lakshmi Marg) to minimize wait times. During Tihar, they dynamically adjust driver locations based on real-time demand spikes.
NTC’s Substation Sites
- Idea: Factor Rating Method.
- How: NTC evaluates substation locations using:
- Cost (land price: Kathmandu = high, Chitwan = low).
- Demand (urban areas need more capacity).
- Infrastructure (reliability of power grids).
- Example: A substation in Bhaktapur scores 9/10 for demand but only 6/10 for cost, while Dhading scores 7/10 for both.
Exam Tip
Quantitative Questions:
- Always show calculations for break-even, learning curves, or center of gravity. Partial credit is given for steps.
- Example: If asked to find Daraz’s break-even point, label each variable (fixed cost, variable cost, price).
Case Studies:
- Link theory to practice: For Ncell’s tower placement, mention proximity to demand (urban areas) and infrastructure (existing fiber networks).
- Compare models: If two location methods are given (e.g., factor rating vs. center of gravity), contrast their use cases (qualitative vs. quantitative).
Diagrams:
- Draw a flowchart for capacity planning steps (e.g., "Demand Forecast → Capacity Requirements → Gap Analysis").
- Label a center of gravity diagram with real cities (e.g., Kathmandu, Pokhara, Biratnagar).
Common Pitfalls:
- Ignoring seasonality: Always note if demand varies (e.g., Daraz in Dashain vs. monsoon).
- Overlooking qualitative factors: Location isn’t just math—consider cultural fit (e.g., a bank in a conservative village may need female tellers).
Based on the TU BIM syllabus for Operations Management (MGT205), unit 6.
Discussion
Loading…