Geographical Information SystemUnit 611 min read
Raster Data Analysis: Techniques, Operations & Applications
Unit 6 of Geographical Information System covers raster data models, core analysis techniques (local, neighborhood, zonal, global), and real-world applications in environmental monitoring, urban planning, and disaster management—with hands-on examples using QGIS and open-source tools.
Core Concepts of Raster Data
Raster data represents spatial information as a grid of cells (pixels), where each cell stores a value (e.g., elevation, land cover, temperature). Unlike vector data (points, lines, polygons), raster data excels at continuous phenomena like terrain, vegetation, or satellite imagery.
Key Characteristics of Raster Data
- Cell Size (Resolution): Smaller cells = higher resolution but larger file size.
- Data Types: Integer (e.g., land use codes), floating-point (e.g., elevation), or categorical (e.g., soil types).
- Noisy Data: Real-world rasters often contain errors (e.g., sensor noise, cloud cover in satellite images).
classDiagram
    class Raster {
        +Grid Structure
        +Cell Values: Integer/Float/Categorical
        +Spatial Resolution: Cell Size
        +No Topology (unlike vectors)
    }
    class Vector {
        +Points/Lines/Polygons
        +Topological Relationships
        +Exact Boundaries
    }
    Raster --> "Converts to" Vector : Rasterization
    Vector --> "Converts to" Raster : Vectorization
Raster Data Analysis Techniques
Raster analysis is categorized into four core operations, each serving different spatial questions.
1. Local Operations (Cell-by-Cell)
Process each cell independently without considering neighbors. Examples:
- Reclassification: Assign new values to cells (e.g., converting elevation to slope classes).
- Algebraic Operations: Combine rasters using math (e.g.,
slope = (elevation - elevation_shift) / cell_size). - Masking: Hide irrelevant areas (e.g., masking a lake in a land-use raster).
Worked Example: Flood Risk Mapping Problem: Identify areas below 100m elevation in Kathmandu Valley. Steps:
- Load a DEM (Digital Elevation Model) raster (e.g., from SRTM).
- Use conditional reclassification:
if elevation < 100: flood_risk = "High" else: flood_risk = "Low" - Overlay with a land-use raster to refine risk zones.
2. Neighborhood (Focal) Operations
Analyze a cell’s value relative to its neighbors (e.g., 3×3 window). Key tools:
- Smoothing: Reduce noise (e.g.,
focal_mean). - Edge Detection: Identify boundaries (e.g.,
focal_variance). - Terrain Analysis: Calculate slope/aspect from elevation.
Example: Identifying Urban Heat Islands Process:
- Use a land surface temperature (LST) raster from MODIS satellite data.
- Apply a focal maximum operation to find hotspots (e.g., 5×5 cell window).
- Overlay with a building footprint raster to pinpoint urban areas.
graph LR
A["LST Raster"] -->|"Focal Max"| B["Hotspot Grid"]
B -->|"Overlay"| C["Building Footprint"]
C --> D["Urban Heat Island Map"]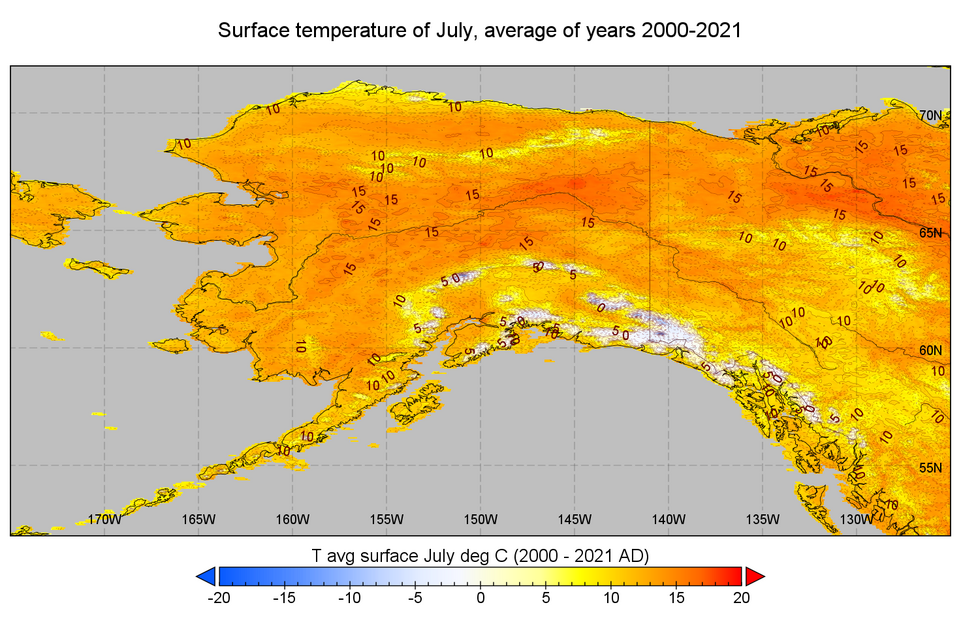 A false-color raster showing temperature gradients (e.g., red = hot, blue = cold). (Image: Merikanto, CC BY-SA 4.0, via Wikimedia Commons)
3. Zonal Operations
Aggregate statistics within predefined zones (e.g., districts, watersheds). Common uses:
- Mean/Max/Min: Calculate statistics per zone (e.g., average rainfall in a district).
- Zonal Statistics: Summarize raster values (e.g., total forest area in Chitwan National Park).
Worked Example: Agricultural Yield Analysis Scenario: A farmer in Pokhara wants to compare rice yields across irrigation zones. Data:
- Yield raster (kg/ha) from drone imagery.
- Irrigation zone vector layer (polygons). Steps:
- Use zonal statistics in QGIS to compute mean yield per zone.
- Export results to a table:
Zone ID Mean Yield (kg/ha) Area (ha) 1 4200 500 2 3800 300
4. Global Operations
Process the entire raster at once (e.g., hillshade, viewshed). Examples:
- Hillshade: Simulate lighting to enhance terrain (used in hiking apps like Pathao Ride).
- Viewshed: Determine visible areas from a viewpoint (e.g., for tower placement).
- Distance: Calculate proximity (e.g., distance to nearest road).
Example: Ncell Tower Placement Problem: Find optimal tower locations in rural Nepal to maximize coverage. Steps:
- Create a DEM raster of the region.
- Generate a viewshed from existing towers.
- Use global distance to identify gaps >5km from coverage.
Raster Data Analysis Workflow in QGIS
Most exams test hands-on steps in QGIS or ArcGIS. Here’s a typical workflow:
flowchart TD
    A["Load Raster Data"] --> B["Preprocess: Clip/Mask"]
    B --> C["Apply Local Operations<br/>(e.g., Reclassify)"]
    C --> D["Neighborhood Analysis<br/>(e.g., Slope)"]
    D --> E["Zonal Statistics<br/>(e.g., District-wise Sum)"]
    E --> F["Global Operations<br/>(e.g., Hillshade)"]
    F --> G["Export Results<br/>(Shapefile/Table)"]
Key QGIS Tools:
| Operation Type | QGIS Tool | Example Use Case |
|---|---|---|
| Local | Raster Calculator | Convert DEM to slope |
| Neighborhood | Slope/Apect | Identify steep terrain for landslides |
| Zonal | Zonal Statistics | Calculate forest cover per municipality |
| Global | Hillshade | Enhance topographic maps for hiking apps |
Advantages and Limitations of Raster Analysis
| Advantages | Limitations |
|---|---|
| Handles continuous data (e.g., climate) | Large file sizes for high resolution |
| Fast for overlay operations | Topological errors (e.g., misaligned edges) |
| Works well with satellite imagery | Difficult to represent exact boundaries |
When to Use Raster vs. Vector:
- Raster: Elevation, land cover, temperature, satellite images.
- Vector: Roads, property boundaries, administrative zones.
In the Real World
eSewa & Kathmandu Traffic Management
- Idea Used: Viewshed analysis and distance operations.
- How? The Kathmandu Metropolitan City uses raster-based digital elevation models (DEMs) to simulate traffic congestion. By analyzing line-of-sight from major intersections, planners identify blind spots where traffic signals fail to cover. This helps optimize signal timing, reducing delays during peak hours (e.g., 7–9 AM on Ring Road).
Daraz & Last-Mile Delivery Optimization
- Idea Used: Zonal statistics and distance analysis.
- How? Daraz’s logistics team uses rasterized delivery zones to calculate the average distance per order in each municipality. By overlaying a population density raster (from census data), they identify high-demand areas (e.g., Lalitpur, Bhaktapur) and optimize warehouse locations. For example, a zonal mean distance of 3.2 km in Kathmandu vs. 5.5 km in Pokhara helps set delivery fees dynamically.
NEPSE & Disaster Risk Mapping
- Idea Used: Local operations (reclassification) and neighborhood analysis (flood modeling).
- How? During monsoons, NEPSE (Nepal Electricity Authority) uses flood susceptibility rasters generated from DEM + rainfall data. By reclassifying elevation into flood-prone zones (e.g., <50m = high risk), they predict outages. A focal maximum operation identifies hotspots where multiple risk factors (slope <5°, proximity to rivers) overlap, allowing preemptive maintenance.
Worked Example: Kathmandu’s Urban Heat Island (UHI) Analysis
Scenario: A student is asked to map UHI in Kathmandu using land surface temperature (LST) and building density rasters.
Given Data:
- LST raster (from Landsat 8, 30m resolution).
- Building footprint raster (from OpenStreetMap, 10m resolution).
Steps:
- Reclassify LST:
- Convert temperatures to categories:
- 25–30°C = Low
- 30–35°C = Medium
35°C = High
- Convert temperatures to categories:
- Neighborhood Analysis:
- Apply a focal mean (3×3) to smooth noise.
- Zonal Statistics:
- Overlay with ward-level polygons to calculate % area with high UHI.
- Global Operation:
- Generate a hillshade of the UHI raster to visualize hotspots.
Expected Output: A map showing wards like Kageshwori (high UHI) vs. Budhanilkantha (low UHI), with a table:
| Ward | % High UHI Area | Building Density (buildings/km²) |
|---|---|---|
| Kageshwori | 65% | 1200 |
| Budhanilkantha | 10% | 400 |
Common Pitfalls in Raster Analysis
Resolution Mismatch:
- Problem: Combining a 30m LST raster with a 10m building raster causes misalignment.
- Fix: Resample the LST to 10m using bilinear interpolation.
Edge Effects:
- Problem: Neighborhood operations near raster edges produce unreliable results.
- Fix: Use a buffer zone or extend the raster with NoData.
NoData Handling:
- Problem: Clouds in satellite data create gaps.
- Fix: Mask NoData cells before analysis.
Exam Tip
What Examiners Look For
Correct Terminology:
- Use terms like focal statistics, zonal overlay, reclassification, and hillshade—not vague phrases like "analyzing data."
- Example: "Apply a 3×3 focal mean to smooth the DEM" (✅) vs. "Make the elevation data cleaner" (❌).
Step-by-Step Workflow:
- Exams often ask for QGIS/ArcGIS steps. Structure answers like this:
1. Load DEM raster → 2. Clip to study area → 3. Calculate slope using Slope tool → 4. Reclassify slope into 5 classes → 5. Export as new raster.
- Exams often ask for QGIS/ArcGIS steps. Structure answers like this:
Real-World Application:
- Always tie examples to Nepalese contexts (e.g., NTC road planning, Daraz logistics, NEPSE outage prediction).
- Example: "This technique is used by NTC to identify flat terrain for new road corridors in hilly districts like Sindhupalchowk."
Visuals in Answers:
- If asked to "explain raster analysis," include a Mermaid flowchart of the workflow or a table comparing local vs. neighborhood operations.
- For numerical questions (e.g., "Calculate slope from a DEM"), show the formula and a sample calculation for 3 adjacent cells.
Common Exam Questions:
- Short Answer:
- "Differentiate between local and zonal operations in raster analysis."
- "How would you identify landslide-prone areas using raster data?"
- Long Answer:
- "Design a workflow to map flood risk in Pokhara using DEM, rainfall, and land-use rasters."
- "Explain how raster analysis helps in optimizing Pathao’s delivery routes."
- Short Answer:
Avoid:
- Describing vector tools (e.g., Buffer) for raster questions.
- Ignoring units (e.g., "slope in degrees" vs. "slope as a ratio").
- Forgetting to validate results (e.g., "Check output with known high-risk zones").
Pro Tip: Practice QGIS exercises on free datasets from:
- USGS EarthExplorer (for DEMs).
- OpenStreetMap (for vector layers).
- Nepal GIS Portal (for Nepal-specific data).
Based on the TU BIT syllabus for Geographical Information System (BIT355), unit 6.
Discussion
Loading…