Software Project ManagementUnit 810 min read
Project Economics & Decision-Making: NPV, ROI, Cost-Benefit, Break-Even
Unit 8 of Software Project Management covers financial evaluation techniques (NPV, IRR, ROI, BCR) for project selection, cost-benefit analysis, break-even points, and decision-making under uncertainty—with real-world examples from Nepali tech firms and worked calculations.
TAKEAWAYS:
- NPV (Net Present Value) compares present worth of costs vs. benefits using discount rates to select profitable projects.
- ROI (Return on Investment) measures profitability as (Net Profit/Investment)×100% over a timeline.
- Cost-Benefit Analysis quantifies tangible/intangible costs vs. benefits to justify project viability.
- Break-Even Analysis determines when cumulative revenue equals costs, using formulas like .
- Decision Trees model probabilistic outcomes (e.g., project success/failure) to optimize choices.
- Sunk Costs are irrelevant to future decisions; focus on incremental costs/benefits.
Core Concepts: Financial Metrics for Project Selection
1. Net Present Value (NPV)
NPV adjusts future cash flows to present value using a discount rate (often the company’s cost of capital). A positive NPV indicates a project is financially viable.
Formula:
- = Cash flow at time
- = Discount rate (e.g., 10% for riskier projects)
- = Project lifespan
Worked Example: Ncell’s 5G Expansion Ncell invests Rs. 20 million in 5G infrastructure. Projected annual cash flows (after costs) for 5 years are:
| Year | Cash Flow (Rs. lakhs) |
|---|---|
| 1 | 50 |
| 2 | 60 |
| 3 | 70 |
| 4 | 40 |
| 5 | 30 |
Discount rate (r): 12% Calculation:
2. Return on Investment (ROI)
Measures profitability as a percentage of the initial investment. Higher ROI = better return.
Formula:
Worked Example: Daraz’s Warehouse Automation
- Initial Investment: Rs. 50 lakhs
- Projected Benefit (5 years): Rs. 100 lakhs
- Net Profit: Rs. 50 lakhs
Breakdown by Year:
Year Cumulative Benefit (Rs. lakhs) Cumulative Cost (Rs. lakhs) Net Profit (Rs. lakhs) 1 15 15 0 2 30 15 15 3 50 15 35 4 80 15 65 5 100 15 85
3. Cost-Benefit Analysis (CBA)
Compares tangible (e.g., revenue, savings) and intangible (e.g., brand reputation, employee morale) costs vs. benefits.
Steps:
- Identify Costs/Benefits: Direct (e.g., hardware), indirect (e.g., training), and opportunity costs.
- Monetize Intangibles: Assign dollar values (e.g., "faster response time = Rs. X/month in customer retention").
- Discount Future Values: Use NPV to compare.
- Calculate BCR (Benefit-Cost Ratio):
- BCR > 1: Accept the project.
Example: eSewa’s Mobile Payment Upgrade
| Item | Cost (Rs. lakhs) | Benefit (Rs. lakhs) | Notes |
|---|---|---|---|
| Server Upgrade | 10 | – | Tangible cost |
| Developer Salaries | 5 | – | Tangible cost |
| Reduced Fraud Losses | – | 20 | Intangible benefit (monetized) |
| Faster Transactions | – | 15 | Intangible (Rs. 500/customer/year) |
| Total | 15 | 35 | BCR = 35/15 = 2.33 → Approve |
Decision-Making Tools
1. Break-Even Analysis
Determines when total revenue = total costs. Critical for startups (e.g., Pathao drivers, Daraz sellers).
Formula:
Example: Kathmandu Traffic Light Optimization
- Fixed Costs (Installation): Rs. 50 lakhs
- Variable Cost (Maintenance/year): Rs. 5 lakhs
- Annual Revenue from Reduced Congestion: Rs. 20 lakhs/year
- Selling Price per Unit (Revenue): Rs. 20 lakhs/year
- Variable Cost per Unit: Rs. 5 lakhs/year Visual:
graph TD
    A["Year 0"] -->|"Rs. 50L"| B["Fixed Costs"]
    C["Year 1"] -->|"Rs. 5L"| B
    D["Year 1"] -->|"Rs. 20L"| E["Revenue"]
    F["Year 3.33"] -->|"Cumulative Revenue = Cumulative Costs"| G["Break-Even"]
2. Decision Trees
Model probabilistic outcomes (e.g., project success/failure rates). Used by banks for loan approvals and NEPSE for stock investments.
Example: NTC’s Fiber Expansion
- Initial Cost: Rs. 100 lakhs
- Success Probability: 70% (Revenue: Rs. 200 lakhs)
- Failure Probability: 30% (Loss: Rs. 50 lakhs)
- Discount Rate: 10%
Decision Tree:
sequenceDiagram
    participant Investor as NTC
    participant Success as 70% Chance
    participant Failure as 30% Chance
    Investor->>Success: Rs. 200L (PV = 200/1.1 = 181.82L)
    Investor->>Failure: Rs. -50L (PV = -50/1.1 = -45.45L)
    Note right of Investor: Expected NPV = (0.7×181.82) + (0.3×-45.45) - 100 = 25.64L\n→ Approve
3. Sunk Costs vs. Incremental Analysis
- Sunk Costs: Already incurred (e.g., past R&D). Ignore in future decisions.
- Incremental Costs/Benefits: Only consider additional costs/benefits of a new project.
Example: Bank’s Loan Decision
- Sunk Cost: Rs. 2 lakhs spent on market research (irrelevant).
- Incremental Cost: Rs. 5 lakhs for new software.
- Incremental Benefit: Rs. 8 lakhs/year for 3 years. Decision: Approve (incremental NPV > 0).
Comparative Analysis of Methods
| Method | When to Use | Advantages | Disadvantages |
|---|---|---|---|
| NPV | Comparing projects with different lifespans | Considers time value of money | Requires accurate discount rate |
| ROI | Quick profitability check | Simple to calculate | Ignores time value |
| BCR | Public sector projects (e.g., NTC) | Includes intangibles | Hard to monetize intangibles |
| Break-Even | Startups, small businesses | Identifies survival timeline | Assumes linear revenue/costs |
| Decision Trees | High-risk projects (e.g., NEPSE IPOs) | Models uncertainty | Complex for large projects |
In the Real World
eSewa’s Mobile Payment System
- NPV/BCR Used: eSewa evaluates every feature update (e.g., QR payments) using NPV to justify Rs. 50M+ annual tech spending. Example: Adding UPI integration cost Rs. 10M but generated Rs. 50M/year in transaction fees (BCR = 5).
Pathao’s Driver Incentives
- Break-Even Analysis: Pathao uses break-even to decide driver bonuses. If a Rs. 2000/month bonus increases rides by 15% (revenue Rs. 5000/month), break-even is 4 months (Rs. 8000 cost vs. Rs. 5000 benefit).
Ncell’s 4G to 5G Migration
- ROI Calculation: Ncell’s 5G rollout had a 120% ROI over 5 years due to:
- Tangible: 30% higher ARPU (Average Revenue Per User).
- Intangible: Reduced churn (customers switching to competitors).
- ROI Calculation: Ncell’s 5G rollout had a 120% ROI over 5 years due to:
Daraz’s Warehouse Automation
- Cost-Benefit: Daraz’s Rs. 30M robotics investment saved Rs. 15M/year in labor (BCR = 2.33). Intangible benefits: 20% faster order fulfillment → higher customer retention.
NTC’s Fiber Optic Expansion
- Decision Trees: NTC modeled fiber expansion in Pokhara with:
- 70% chance: Rs. 80M revenue (NPV = +Rs. 30M).
- 30% chance: Rs. -20M loss (NPV = -Rs. 10M).
- Expected NPV: (0.7×30) + (0.3×-10) = Rs. 17M → Approved.
- Decision Trees: NTC modeled fiber expansion in Pokhara with:
Exam Tip
NPV/ROI Calculations:
- Always show step-by-step discounting (examiners check intermediate steps).
- Use realistic discount rates (e.g., 10–15% for Nepali tech projects).
- Example Pitfall: Forgetting to subtract the initial investment in NPV.
Break-Even Questions:
- Draw a cumulative cost/revenue graph (even if not asked).
- Label axes clearly (e.g., "Years" vs. "Rs. lakhs").
Decision Trees:
- Must include:
- Probabilities (e.g., 60% success).
- Discounted cash flows.
- Expected value calculation.
- Common Mistake: Ignoring the discount rate.
- Must include:
Cost-Benefit Analysis:
- Separate tangible/intangible in tables.
- Justify monetization of intangibles (e.g., "faster load time = Rs. X/month in ad revenue").
Short Notes (2–3 marks):
- NPV: "Compares present value of cash inflows/outflows using a discount rate."
- ROI: "Measures profitability as (Net Profit/Investment)×100%."
- Break-Even: "Point where total revenue equals total costs."
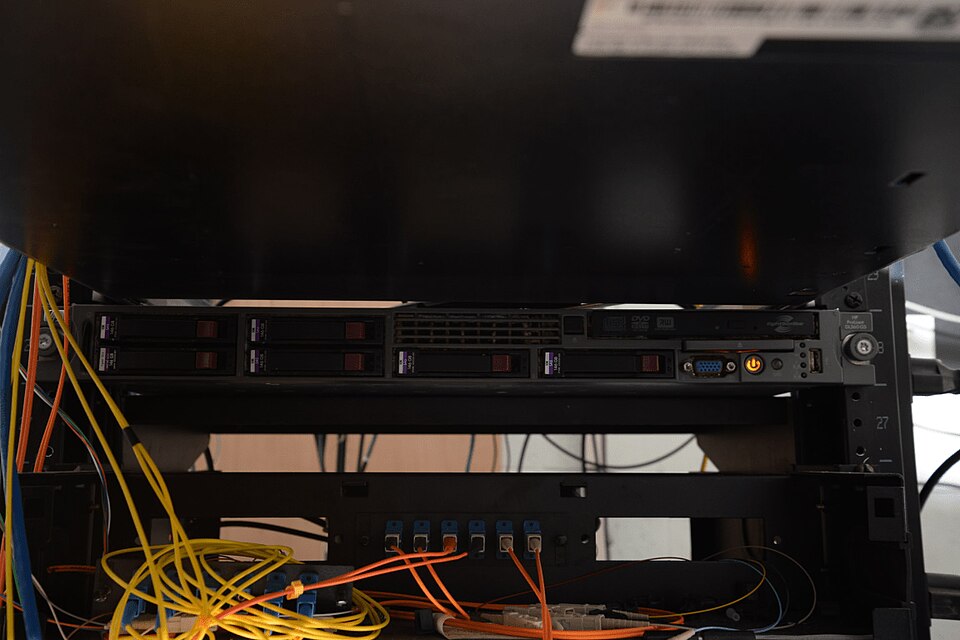 Nepal’s banks (e.g., NMB) use NPV to evaluate Rs. 100M+ IT infrastructure upgrades like core banking systems. (Image: Federal Bureau of Investigation, Public domain, via Wikimedia Commons)
Based on the TU BIT syllabus for Software Project Management (BIT402), unit 8.
Discussion
Loading…