Software Project ManagementUnit 711 min read
Project Monitoring, Control & Quality Assurance: Techniques, Tools & Metrics
Unit 7 of Software Project Management covers systematic approaches to track project health, correct deviations, and ensure deliverables meet quality standards—using techniques like Earned Value Analysis, quality gates, and control charts, with real-world applications in Nepalese tech firms.
TAKEAWAYS:
- Monitoring uses metrics (e.g., SPI, CPI) to compare planned vs. actual progress in real-time, while control applies corrective actions via tools like Gantt charts and Pareto analysis.
- Quality assurance relies on preventive techniques (reviews, inspections) and corrective techniques (testing, metrics) to reduce defects before they reach users.
- Critical path analysis identifies the longest sequence of tasks (e.g., in a Daraz delivery system) that dictates project duration—delaying any task here delays the entire project.
- Earned Value Management (EVM) integrates scope, schedule, and cost into a single metric (e.g., SV = -5 means behind schedule by 5 days).
- Quality models (e.g., McCall’s, ISO 9001) break quality into factors like product operation, revision, and transition, helping teams prioritize improvements.
- Agile monitoring uses burndown charts and velocity tracking to adjust sprints dynamically, while traditional projects use milestone tracking and risk registers.
1. Definitions: Monitoring vs. Control vs. Quality Assurance
Monitoring and controlling are interdependent processes in project management. While monitoring involves collecting data (e.g., progress reports, defect logs), controlling uses that data to take corrective actions (e.g., reallocating resources, adjusting timelines). Quality Assurance (QA) is a broader discipline that prevents defects through processes like reviews and testing, whereas Quality Control (QC) detects and fixes defects after they occur.
2. Techniques for Project Monitoring and Control
A. Earned Value Management (EVM)
EVM integrates scope, schedule, and cost into three key metrics:
- Planned Value (PV): Budgeted cost of work scheduled (BCWS).
- Earned Value (EV): Budgeted cost of work performed (BCWP).
- Actual Cost (AC): Real cost incurred.
Key Formulas:
| Metric | Formula | Interpretation |
|---|---|---|
| Schedule Variance (SV) | EV - PV |
Positive = Ahead of schedule; Negative = Behind |
| Cost Variance (CV) | EV - AC |
Positive = Under budget; Negative = Over budget |
| Schedule Performance Index (SPI) | EV / PV |
>1 = Good; <1 = Poor |
| Cost Performance Index (CPI) | EV / AC |
>1 = Efficient; <1 = Inefficient |
Worked Example: Ncell App Development
- Planned Value (PV): Rs. 500,000 for 4 weeks (app backend development).
- Earned Value (EV): Only 60% of work done after 4 weeks (EV = Rs. 300,000).
- Actual Cost (AC): Rs. 400,000 spent. Calculations:
- SV = 300,000 - 500,000 = -200,000 (2 weeks behind schedule).
- CPI = 300,000 / 400,000 = 0.75 (25% over budget). Action: Hire more developers or extend the deadline.
B. Critical Path Method (CPM)
The longest path in a project network diagram determines the minimum project duration. Any delay on this path delays the entire project.
Example: eSewa Payment Gateway Upgrade
graph TD
    A["Design API"] -->|"3 weeks"| B["Develop Backend"]
    A -->|"2 weeks"| C["Test UI"]
    B -->|"4 weeks"| D["Integrate with Banks"]
    C -->|"3 weeks"| D
    D -->|"2 weeks"| E["Deploy"]
Critical Path: A → B → D → E (Total = 11 weeks).
Non-Critical Path: A → C → D (Float = 2 weeks).
C. Gantt Charts and Pert Charts
- Gantt Charts: Visualize task timelines, dependencies, and resource allocation.
- PERT Charts: Focus on probabilistic time estimates (optimistic, pessimistic, most likely).
Comparison Table:
| Feature | Gantt Chart | PERT Chart |
|---|---|---|
| Purpose | Task scheduling & resource tracking | Time estimation & risk analysis |
| Time Estimate | Fixed dates | Triangular distribution (O, P, M) |
| Dependencies | Clear arrows | Probabilistic paths |
| Use Case | Construction, software sprints | R&D projects, high-risk ventures |
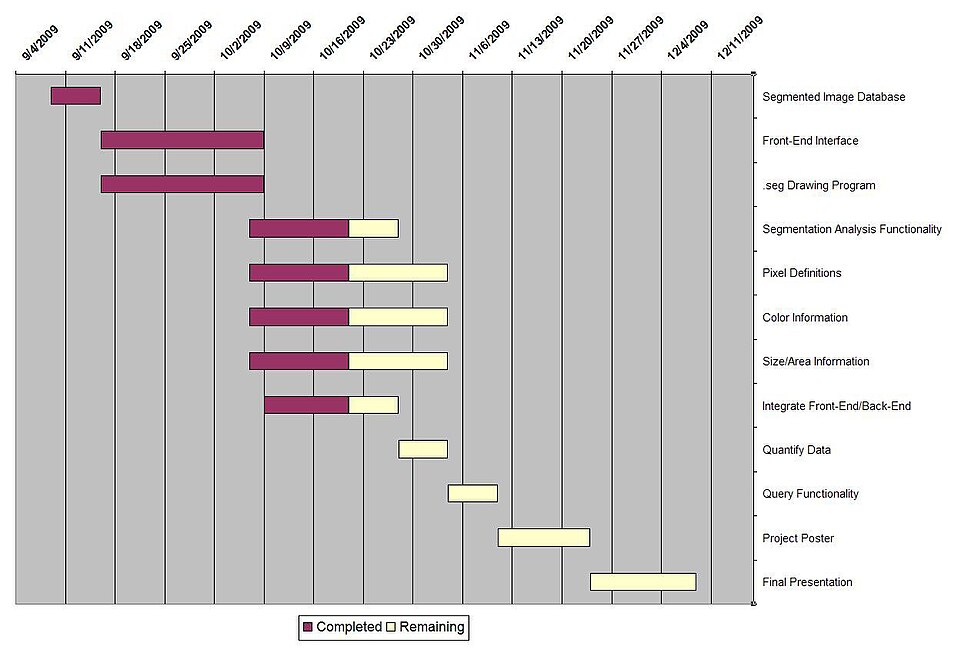 Sample for a Daraz delivery project (Image: Alex Thompson and Derrek Harrison, Public domain, via Wikimedia Commons)
3. Quality Assurance Techniques
A. Preventive Techniques
- Reviews and Inspections
- Fagan Inspection: Formal review with moderators, readers, and authors.
- Walkthroughs: Informal group review of code/documentation.
- Static Testing
- Code Reviews: Peer checks for bugs, security flaws, or inefficiencies.
- Static Analysis Tools: SonarQube, Checkstyle (detects coding standard violations).
- Process Improvements
- CMMI (Capability Maturity Model Integration): Levels 1–5 for process maturity.
- Six Sigma: Reduces defects to 3.4 per million (used by banks like NMB).
B. Corrective Techniques
- Dynamic Testing
- Unit Testing: JUnit, pytest (individual components).
- Integration Testing: Verify modules work together (e.g., WhatsApp API + Database).
- System Testing: End-to-end validation (e.g., Pathao fare calculation).
- Defect Tracking
- Bug Tracking Tools: Jira, Bugzilla (prioritize fixes using MoSCoW method).
- Root Cause Analysis (RCA): Fishbone diagram to identify defect sources.
C. Quality Models
| Model | Factors Measured | Example Application |
|---|---|---|
| McCall’s Model | Product operation, revision, transition | eSewa app usability & scalability |
| ISO 9001 | Process consistency, customer focus | NTC network reliability |
| Boehm’s Model | Correctness, reliability, efficiency | NEPSE trading platform stability |
4. Modern Project Management Practices
A. Agile Monitoring
- Burndown Charts: Track work remaining in a sprint (e.g., Daraz’s daily standups).
- Velocity Tracking: Average story points completed per sprint (e.g., Khalti’s 2-week cycles).
- Kanban Boards: Visualize workflow stages (To Do, In Progress, Done).
B. DevOps and Continuous Monitoring
- CI/CD Pipelines: Automated testing/deployment (e.g., Google’s SRE practices).
- Real-Time Dashboards: Grafana, Prometheus (monitor server health, API latency).
C. Risk-Based Monitoring
- Risk Register: Track probability/impact of risks (e.g., Ncell network outage during Diwali).
- Monte Carlo Simulation: Predict project outcomes under uncertainty.
5. Tools for Monitoring and Control
| Tool Category | Tools Examples | Use Case |
|---|---|---|
| Scheduling | Microsoft Project, GanttProject | Timeline planning for NEPSE apps |
| Issue Tracking | Jira, Trello | Bug fixes in eSewa |
| Collaboration | Slack, Microsoft Teams | Daily standups for Daraz teams |
| Quality Metrics | SonarQube, Splunk | Code quality in Ncell apps |
| Financial | QuickBooks, Excel | ROI calculation for Pathao |
In the Real World
eSewa’s Quality Gates
- Before every transaction, eSewa runs multi-layered testing (unit → integration → security) to prevent fraud. Their critical path includes bank API integration, which must be 100% reliable during Dashain sales peaks.
- Real Example: In 2022, eSewa’s burndown chart showed a sprint delay due to a third-party bank API failure. They rerouted tasks to their backup payment processor (Khalti) and recovered on time.
Pathao’s Driver App Monitoring
- Pathao uses real-time dashboards to track:
- Driver availability (SPI: % of drivers online vs. planned).
- Ride completion time (CPI: cost per ride vs. budgeted driver earnings).
- Their critical path is ride matching algorithm → GPS tracking → payment processing, where a delay in any step causes user churn.
- Pathao uses real-time dashboards to track:
NTC’s Network Reliability (ISO 9001)
- NTC monitors packet loss and latency using control charts to ensure 99.9% uptime. If metrics deviate (e.g., SV = -2 hours during a festival), they reroute traffic via backup fiber cables.
- IMAGE: fiber optic cable | NTC’s backup fiber route in Kathmandu
Exam Tip
For EVM Questions:
- Always calculate SV, CV, SPI, CPI and interpret them (e.g., "The project is 15% over budget").
- Example: If PV = Rs. 200K, EV = Rs. 150K, AC = Rs. 180K, then:
- SV = -50K (behind schedule).
- CPI = 0.83 (over budget).
- Action: "Reallocate resources to Task C or extend deadline by 2 weeks."
For Critical Path:
- Draw the AOA (Activity-on-Arrow) or AON (Activity-on-Node) diagram.
- Example: Given:
Critical Path:Task A (2w) → Task B (3w) Task A → Task C (4w) → Task D (1w)A → C → D(7 weeks).
For Quality Techniques:
- Preventive: Mention reviews, inspections, CMMI.
- Corrective: Mention testing (unit → system), defect tracking (Jira), RCA.
- Models: Link McCall’s to product quality, ISO 9001 to process quality.
For Agile vs. Traditional:
- Agile: Burndown charts, velocity, Kanban.
- Traditional: Gantt charts, milestone tracking, risk registers.
Numerical Questions:
- ROI:
(Net Profit / Cost) × 100.- Example: Initial investment = Rs. 5L, benefit = Rs. 10L over 5 years. ROI = (10L - 5L) / 5L × 100 = 100%.
- NPV: Use formula
NPV = Σ [CFt / (1 + r)^t] - Initial Investment.- Example: If CF = Rs. 2L/year for 5 years, r = 10%:
NPV = 2/(1.1)^1 + 2/(1.1)^2 + ... - 5L ≈ Rs. 3.7L(positive → invest).
- Example: If CF = Rs. 2L/year for 5 years, r = 10%:
- ROI:
Final Note: Always relate answers to Nepalese contexts (e.g., Daraz logistics, Ncell apps, NEPSE trading). Use real numbers (Rs. values, weeks) in examples to score full marks.
Based on the TU BIT syllabus for Software Project Management (BIT402), unit 7.
Discussion
Loading…