Economics for BusinessUnit 47 min read
Production Functions, Returns, Stages & Real-World Tech Applications
Unit 4 of Economics for Business explores how firms combine inputs (land, labor, capital) to produce outputs, analyzing short-run vs. long-run production, stages of returns, and how technology (like AI in Daraz or Ncell’s automation) reshapes production efficiency—with Nepalese and global examples.
Key Concepts & Definitions
1. Production Function
A production function shows the technical relationship between inputs (factors of production) and outputs (goods/services). Mathematically: where:
- = Quantity of output
- = Labor
- = Capital
- = Natural resources (land)
- = Management/Entrepreneurship
Visual: Real-World Link:
- Daraz’s Warehouse Automation: Uses robots and AI to optimize labor () and capital () to maximize output (deliveries). If Daraz hires more workers but keeps machines fixed, output rises but at a decreasing rate (diminishing returns).
2. Short-Run vs. Long-Run Production
| Aspect | Short-Run | Long-Run |
|---|---|---|
| Time Frame | At least one input is fixed (e.g., factory size). | All inputs are variable. |
| Adjustments | Only labor can be changed. | Firms can build new plants, adopt tech. |
| Returns | Diminishing returns apply. | Economies/diseconomies of scale. |
| Example | A restaurant hiring more chefs (but kitchen size fixed). | A tech startup scaling servers and hiring engineers. |
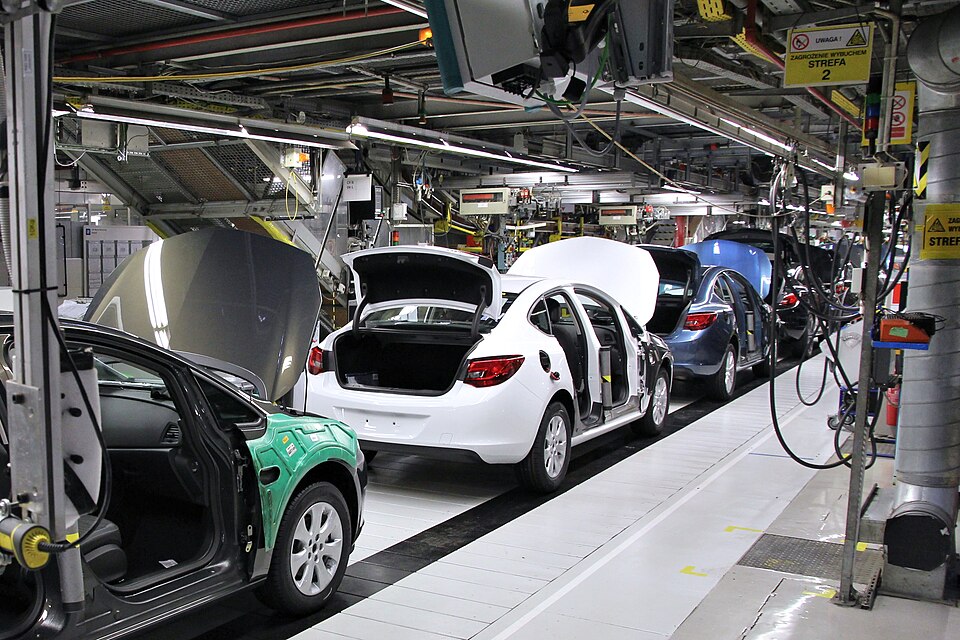 Short-run: Adding workers to a fixed assembly line; long-run: Expanding the factory. (Image: Marek Ślusarczyk (Tupungato) Photo portfolio, CC BY 3.0, via Wikimedia Commons)
3. Stages of Production (Law of Variable Proportions)
When only one input (usually labor) varies while others (like capital) are fixed, output behaves in three stages:
Worked Example: Ncell’s Call Center
- Stage I: Hire 1–3 operators → calls handled rise rapidly (efficient use of fixed phones/computers).
- Stage II: Hire 4–10 operators → each new hire adds less (e.g., 10th operator handles only 5% more calls).
- Stage III: Hire 15+ operators → congestion; output drops (e.g., dropped calls rise).
Visual:
4. Returns to Scale (Long-Run)
When all inputs change proportionally, output can grow at different rates:
| Type | Description | Example |
|---|---|---|
| Increasing Returns | Doubling inputs > doubles output. | WhatsApp scaling servers globally. |
| Constant Returns | Doubling inputs = doubles output. | A small bakery opening a second branch. |
| Decreasing Returns | Doubling inputs < doubles output. | Overcrowded Kathmandu traffic (more cars → slower speed). |
Visual:
5. Production Possibility Curve (PPC) & Efficiency
The PPC shows maximum output combinations of two goods with fixed resources. Efficiency means producing on the curve.
Worked Example: Nepal’s Agriculture vs. Manufacturing
- Point A: 100 tons rice + 50 tons textiles (efficient).
- Point B: 80 tons rice + 60 tons textiles (inefficient; underutilized resources).
- Point C: 120 tons rice + 30 tons textiles (possible but requires shifting resources).
Visual:
In the Real World
- Khalti’s Payment Processing
- Idea: Diminishing returns to labor in customer support.
- How: Adding more agents initially reduces wait times (Stage I), but beyond 50 agents, each new hire adds marginal value (Stage II). Khalti now uses chatbots to avoid Stage III.
Pathao’s Driver-Fleet Management
- Idea: Returns to scale in ride-hailing.
- How: Doubling drivers in a city (e.g., Kathmandu) initially doubles rides (constant returns), but past a threshold, congestion reduces efficiency (diminishing returns). Pathao uses dynamic pricing to optimize.
NTC’s Network Expansion
- Idea: Long-run production with capital investment.
- How: Building new towers (capital) and hiring engineers (labor) allows NTC to scale beyond short-run constraints. Each new tower in remote areas (e.g., Dolpa) follows increasing returns until saturation.
Exam Tip
Diagrams Are Mandatory
- Always draw PPC, stages of production, or returns-to-scale graphs with labeled axes and stages. Examiners deduct marks for missing labels (e.g., "Stage II" or "Diminishing Returns").
Real-World Application Questions
- Expect questions like: "How does Daraz’s use of automation reflect the law of variable proportions?" Answer: Automation fixes capital (robots), while labor (workers) varies → initially increasing returns (robots + workers boost efficiency), then diminishing returns as workers become redundant.
Short-Run vs. Long-Run Confusion
- Short-run: "Fixed factory size" or "hiring temporary workers."
- Long-run: "Building a new factory" or "adopting AI."
- Trick: If the question mentions "time to build a new plant," it’s long-run.
Numerical Problems
- Practice calculating marginal product (MP) and average product (AP):
- Given: Labor (L) = 1, 2, 3, 4; Output (Q) = 10, 25, 40, 50.
- MP = ΔQ/ΔL → MP of 3rd worker = 40–25 = 15.
- AP = Q/L → AP at L=3 = 40/3 ≈ 13.33.
- Practice calculating marginal product (MP) and average product (AP):
Common Pitfalls
- ❌ Saying "diminishing returns apply in the long run." (It’s short-run!)
- ❌ Ignoring units in graphs (e.g., labeling "Labor" without "units: workers").
- ❌ Mixing technical efficiency (max output from inputs) with allocative efficiency (producing what consumers want).
Final Checklist Before Exam: ✅ Can you sketch all three stages of production with numbers? ✅ Can you explain why a bank opening a new branch is long-run but hiring tellers is short-run? ✅ Can you link Nepal’s traffic congestion to diminishing returns? ✅ Do you know how to calculate MP and AP from a table?
Based on the TU BITM syllabus for Economics for Business (ECO206), unit 4.
Discussion
Loading…