BiologyUnit 77 min read
Ecology & Ecosystems: Biomes, Food Chains, Cycles & Human Impact
Unit 7 of Biology explains how living things interact in nature—ecosystems, food webs, nutrient cycles, and how humans affect them. Learn definitions, real-world examples, and NEB-style questions with step-by-step solutions.
What is Ecology?
Ecology is the study of how living things (plants, animals, microbes) interact with each other and their environment. It helps us understand:
- How energy flows from the sun to animals.
- How nutrients recycle in nature.
- Why some species become endangered.
Key Terms:
- Ecosystem: A community of living things (biotic) + their physical surroundings (abiotic). mermaid classDiagram class Organism {e.g., a frog} class Population {All frogs in a pond} class Community {Frogs + fish + plants} class Ecosystem {Community + water + sunlight} class Biome {All tropical rainforests} class Biosphere {All biomes on Earth} Organism --> Population : "→" Population --> Community : "→" Community --> Ecosystem : "→" Ecosystem --> Biome : "→" Biome --> Biosphere : "→"
---
## Food Chains and Food Webs
### Food Chain
A **linear** path showing how energy moves from one organism to another:
**Producer → Primary Consumer → Secondary Consumer → Tertiary Consumer**.
Example:
Grass → Grasshopper → Frog → Snake → Hawk.

```figure
{"type":"graph","fns":[{"expr":"x","label":"Energy (10% transferred)"},{"expr":"0.1*x","label":"Next level"}],"x":[0,100],"points":[{"x":100,"y":100,"label":"Grass"},{"x":10,"y":10,"label":"Grasshopper"},{"x":1,"y":1,"label":"Frog"}]}
Food Web
A network of interconnected food chains. Shows how organisms have multiple food sources. Example:
graph LR
    Grass --> Grasshopper
    Grass --> Deer
    Grasshopper --> Frog
    Deer --> Wolf
    Frog --> Snake
    Snake --> Hawk
    Wolf --> Hawk
Why food webs matter:
- If one species disappears (e.g., frogs), others are affected.
- Shows interdependence in nature.
Ecological Pyramids
Show the relationship between organisms at different trophic levels.
1. Pyramid of Numbers
Counts the number of organisms at each level.
Example: 1000 trees → 200 deer → 50 wolves → 10 tigers.
2. Pyramid of Biomass
Shows the total mass of organisms at each level (usually decreases upward).
3. Pyramid of Energy
Shows energy flow (always decreases by 90% at each level due to heat loss).
Key Rule: Only 10% of energy is transferred to the next level (rest is lost as heat or waste).
Nutrient Cycles
Nutrients (like carbon, nitrogen, water) cycle between living things and the environment.
1. Water Cycle
flowchart TD
    A["Sun"] --> B["Evaporation"]
    B --> C["Condensation"]
    C --> D["Precipitation"]
    D --> E["Runoff/Infiltration"]
    E --> B
    D --> F["Plants/Animals"]
    F --> B
2. Carbon Cycle
flowchart TD
    A["Atmosphere CO₂"] --> B["Plants absorb CO₂"]
    B --> C["Animals eat plants"]
    C --> D["Respiration releases CO₂"]
    D --> A
    C --> E["Decomposition"]
    E --> A
3. Nitrogen Cycle
flowchart TD
    A["Nitrogen gas"] --> B["Nitrogen-fixing bacteria"]
    B --> C["Ammonia"]
    C --> D["Nitrifying bacteria"]
    D --> E["Nitrates"]
    E --> F["Plants absorb nitrates"]
    F --> G["Animals eat plants"]
    G --> H["Decomposers"]
    H --> I["Ammonia"]
    I --> C
Why cycles matter:
- Prevent nutrient loss.
- Maintain balance in ecosystems.
Ecological Succession
The gradual change in an ecosystem over time. Two types:
- Primary Succession: Starts from bare rock (e.g., new volcanic island).
- Lichen → Moss → Grasses → Shrubs → Trees.
- Secondary Succession: After a disturbance (e.g., fire, flood).
- Weeds → Grasses → Shrubs → Forest.
Human Impact on Ecosystems
Humans affect ecosystems through:
- Pollution: Air, water, soil pollution (e.g., plastic waste, chemicals).
- Deforestation: Cutting forests → loss of habitat.
- Overhunting: Reduces prey populations.
- Climate Change: Global warming alters habitats.
Example: The tragedy of the commons (overuse of shared resources).
NEB-Style Questions and Solutions
Short Answer Questions
Define ecosystem and give two examples.
- Answer: An ecosystem is a community of living organisms interacting with their physical environment. Examples: Forest ecosystem, pond ecosystem.
What is a food web? Why is it more accurate than a food chain?
- Answer: A food web shows multiple interconnected food chains. It’s more accurate because it represents the complex feeding relationships in nature (e.g., a frog may eat insects and small fish).
Explain the 10% energy transfer rule.
- Answer: Only 10% of energy is passed from one trophic level to the next due to:
- Heat loss (metabolism).
- Uneaten parts of prey.
- Energy used for movement.
- Answer: Only 10% of energy is passed from one trophic level to the next due to:
Long Answer Questions
Describe the carbon cycle with a diagram.
- Answer:
The carbon cycle involves:
- Photosynthesis: Plants absorb CO₂ from the atmosphere.
- Respiration: Animals/plants release CO₂ back.
- Decomposition: Dead organisms break down, releasing CO₂.
- Combustion: Burning fossil fuels adds CO₂.
flowchart TD
    A["Atmosphere CO₂"] --> B["Plants"]
    B --> C["Animals"]
    C --> D["Respiration"]
    D --> A
    C --> E["Death"]
    E --> F["Decomposers"]
    F --> A
    G["Fossil Fuels"] --> A
- Answer:
The carbon cycle involves:
How does deforestation affect an ecosystem?
- Answer:
- Loss of habitat → endangered species.
- Increased CO₂ → global warming.
- Soil erosion → reduced fertility.
- Disrupted water cycle → floods/droughts.
- Answer:
Diagram-Based Questions
- Draw and label a pyramid of biomass for a pond ecosystem.
- Answer:
- Explanation: Phytoplankton (producers) have the highest biomass. Each level has 10x less biomass than the one below.
- Answer:
Exam Tip
- Memorize key terms: Ecosystem, niche, succession, trophic levels.
- Draw diagrams: Food webs, pyramids, nutrient cycles (always label axes!).
- Explain processes: Use bullet points for cycles (e.g., nitrogen fixation → nitrification → assimilation).
- Link to real life: Relate deforestation to climate change or pollution to health.
- Practice calculations: If given energy values, calculate % transfer (e.g., "If producers have 10,000 kJ, how much do secondary consumers get?" → 100 kJ).
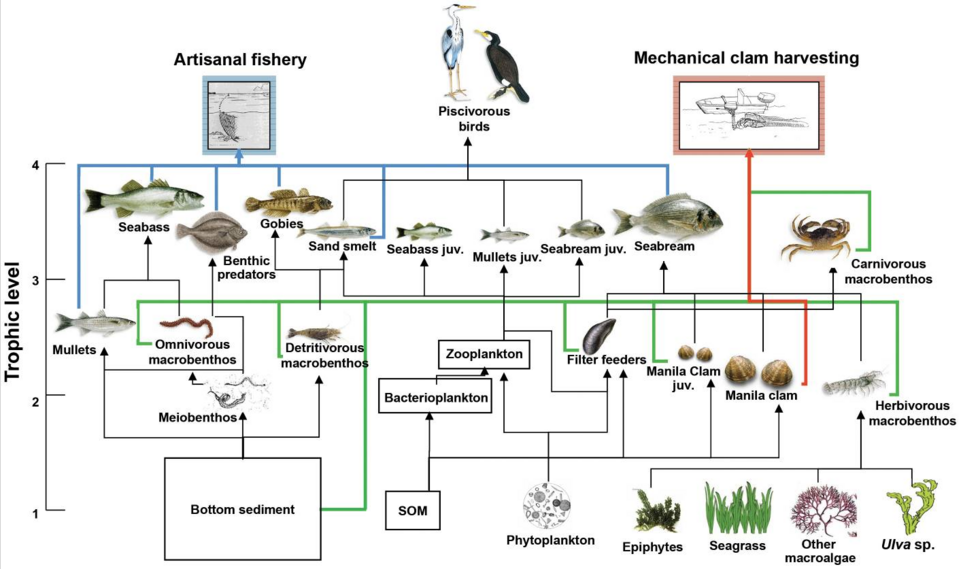 A complex food web showing multiple predators and prey. (Image: Heymans, J.J., Coll, M., Libralato, S., Morissette, L. and C, CC BY 4.0, via Wikimedia Commons)
Based on the NEB +2 Science syllabus for Biology (Bio), unit 7.
Discussion
Loading…