Computer ScienceUnit 611 min read
Programming Logic: Algorithms & Flowcharts – Design, Steps & Symbols
Unit 6 of Computer Science teaches how to write step-by-step instructions (algorithms) for computers and represent them visually using flowcharts. You’ll learn the rules for writing algorithms, flowchart symbols, and how to convert between algorithms and flowcharts—essential skills for solving problems in programming a
TAKEAWAYS:
- An algorithm is a clear, finite set of instructions to solve a problem, with specific rules like definiteness, finiteness, and input/output.
- Flowcharts use standard symbols (oval, rectangle, diamond, parallelogram) to represent steps, decisions, and input/output in a program’s logic.
- Pseudocode is a mix of English and code-like steps that helps design algorithms before writing actual programs.
- Flowcharts must follow rules like a single entry/exit point, arrows for direction, and proper labeling of symbols.
- Decision symbols (diamonds) split the flow based on conditions (e.g., "Is x > 10?"), while loops (rectangles with arrows) repeat steps until a condition changes.
- Practice converting word problems into algorithms and flowcharts to prepare for NEB exam questions.
---

### What is an Algorithm?
An **algorithm** is a step-by-step method to solve a problem or perform a task. Think of it like a recipe: if you follow the steps in order, you’ll get the right result every time. For example, to make a cup of tea, you might write:
1. Boil water.
2. Add tea leaves.
3. Pour into a cup.
4. Add milk/sugar if desired.

**Key Properties of an Algorithm:**
1. **Definite**: Each step must be clear and unambiguous.
2. **Finite**: It must end after a finite number of steps.
3. **Input**: It should accept input (e.g., "How many cups of tea?").
4. **Output**: It must produce a result (e.g., "Ready tea").
5. **Effectiveness**: Each step must be doable with available resources.

```figure
{"type":"timeline","events":[{"date":"Step 1","label":"Boil water"},{"date":"Step 2","label":"Add tea leaves"},{"date":"Step 3","label":"Pour into cup"},{"date":"Step 4","label":"Add milk/sugar (optional)"}],"caption":"Example: Algorithm for Making Tea"}
Why Do We Need Algorithms?
Algorithms are the blueprint for programs. Before writing code in languages like C or Python, programmers design algorithms to:
- Break down complex problems into simple steps.
- Test logic without writing full programs.
- Communicate ideas clearly to others (or even to yourself!).
Example Problem: "Write an algorithm to find the largest of three numbers (A, B, C)."
Solution:
- Start with A as the largest.
- Compare A with B. If B > A, set largest = B.
- Compare largest with C. If C > largest, set largest = C.
- Output the largest number.
Pseudocode: Writing Algorithms in Simple Steps
Pseudocode is a mix of English and programming-like syntax. It’s not a real programming language but helps plan logic. For example:
ALGORITHM FindLargest(A, B, C)
    largest = A
    IF B > largest THEN
        largest = B
    END IF
    IF C > largest THEN
        largest = C
    END IF
    PRINT "The largest number is:", largest
END ALGORITHM
Key Pseudocode Rules:
- Use keywords like
IF,ELSE,FOR,WHILE(capitalized for clarity). - Indent blocks for readability (e.g., steps inside
IF). - Avoid real programming syntax (e.g., no
==or;).
Flowcharts: Drawing Algorithms Visually
A flowchart is a diagram that represents an algorithm using standardized symbols. It helps visualize the flow of logic, especially for decisions and loops.
Flowchart Symbols:
| Symbol | Name | Purpose | Example Usage |
|---|---|---|---|
| Terminal | Start/Stop point | "START" or "END" | |
| Process | Actions/calculations | "Add 5 to x" | |
| Decision | Yes/No questions | "Is x > 10?" | |
| Input/Output | Data input or output | "Enter a number" | |
| Flow Line | Direction of flow | Connects symbols |
flowchart TD
    A["START"] --> B[/Enter three numbers: A, B, C/]
    B --> C{"Is B > A?"}
    C -->|"Yes"| D["Set largest = B"]
    C -->|"No"| E["Keep largest = A"]
    D --> F{"Is C > largest?"}
    E --> F
    F -->|"Yes"| G["Set largest = C"]
    F -->|"No"| H[\nThe largest number is: largest\n]
    H --> I["END"]
Rules for Drawing Flowcharts:
- Single Entry/Exit: Only one "START" and one "END" point.
- Arrows: Show the direction of flow (top-to-bottom or left-to-right).
- Labels: Every symbol must be labeled clearly.
- Decisions: Diamonds must have two exits (Yes/No or True/False).
- Loops: Use arrows to show repetition (e.g., back to a decision).
Converting Algorithms to Flowcharts (and Vice Versa)
Example: Convert the "Find Largest of Three Numbers" algorithm into a flowchart. We already drew it above! Now, let’s trace it:
- Start → Input A, B, C.
- Decision: Is B > A? If yes, update largest; else, keep A.
- Decision: Is C > largest? If yes, update largest.
- Output the result → End.
Reverse Example: Convert this flowchart into pseudocode. (Assume a flowchart with steps: Start → Input x → Is x > 0? → If yes, print "Positive"; else print "Non-positive" → End.)
ALGORITHM CheckPositive(x)
    PRINT "Enter a number: x"
    IF x > 0 THEN
        PRINT "Positive"
    ELSE
        PRINT "Non-positive"
    END IF
END ALGORITHM
Types of Flowcharts
- Top-Down Flowcharts: Start at the top and flow downward (most common).
- Bottom-Up Flowcharts: Start at the bottom (rare, used in specific cases).
- Program Flowcharts: Show the logic of a program (e.g., loops, decisions).
- System Flowcharts: Show data flow between systems (used in business/IT).
Advantages and Disadvantages
| Advantages | Disadvantages |
|---|---|
| Easy to understand visually. | Can become complex for large programs. |
| Helps spot logic errors early. | Time-consuming to draw manually. |
| Useful for teaching and documentation. | Requires practice to master symbols. |
| Works for any programming language. | Not executable (must be converted to code). |
Solved Example: Algorithm and Flowchart for Factorial
Problem: Write an algorithm and flowchart to find the factorial of a number n (e.g., 5! = 5 × 4 × 3 × 2 × 1 = 120).
Algorithm:
- Start.
- Input
n. - Initialize
factorial = 1. - While
n > 0:- Multiply
factorialbyn. - Decrement
nby 1.
- Multiply
- Output
factorial. - End.
flowchart TD
    A["START"] --> B[/Enter n/]
    B --> C["Set factorial = 1"]
    C --> D{"Is n > 0?"}
    D -->|"Yes"| E["factorial = factorial * n"]
    E --> F["n = n - 1"]
    F --> D
    D -->|"No"| G[\nFactorial = factorial\n]
    G --> H["END"]
Trace for n = 4:
| Step | Action | factorial | n |
|---|---|---|---|
| 1 | Start | - | 4 |
| 2 | Input 4 | - | 4 |
| 3 | factorial = 1 | 1 | 4 |
| 4 | 4 > 0? → Yes | 1 | 4 |
| 5 | factorial = 1 * 4 = 4 | 4 | 4 |
| 6 | n = 4 - 1 = 3 | 4 | 3 |
| 7 | 3 > 0? → Yes | 4 | 3 |
| 8 | factorial = 4 * 3 = 12 | 12 | 3 |
| 9 | n = 3 - 1 = 2 | 12 | 2 |
| 10 | 2 > 0? → Yes | 12 | 2 |
| 11 | factorial = 12 * 2 = 24 | 24 | 2 |
| 12 | n = 2 - 1 = 1 | 24 | 1 |
| 13 | 1 > 0? → Yes | 24 | 1 |
| 14 | factorial = 24 * 1 = 24 | 24 | 1 |
| 15 | n = 1 - 1 = 0 | 24 | 0 |
| 16 | 0 > 0? → No | 24 | 0 |
| 17 | Output 24 | 24 | 0 |
| 18 | End | - | - |
Common Mistakes to Avoid
- Unclear Steps: Writing steps like "Calculate something" without details.
- ❌ "Calculate total."
- ✅ "total = price × quantity."
- Infinite Loops: Forgetting to update a loop variable (e.g.,
n = n - 1). - Missing Input/Output: Assuming the user knows what to input or where results go.
- Incorrect Decision Symbols: Using rectangles for decisions or diamonds for actions.
- No End Point: Forgetting to mark the end of the algorithm.
NEB Board-Style Questions
Question 1: Short Answer
"What are the three main symbols used in flowcharts? Give one example of each." Answer:
- Terminal (Oval): "START" or "END."
- Process (Rectangle): "Add 5 to x."
- Decision (Diamond): "Is x > 10?"
Question 2: Algorithm Design
"Write an algorithm to check if a number is even or odd." Answer:
- Start.
- Input a number
n. - Divide
nby 2 and store the remainder inremainder. - If
remainder = 0, print "Even." - Else, print "Odd."
- End.
Question 3: Flowchart Conversion
"Convert the following algorithm into a flowchart: ALGORITHM SumOfDigits(n) sum = 0 While n > 0: digit = n mod 10 sum = sum + digit n = n / 10 (integer division) Print sum END ALGORITHM" Flowchart Steps:
- Start → Input
n→ Setsum = 0. - Decision: Is
n > 0?- Yes →
digit = n mod 10→sum = sum + digit→n = n / 10→ Back to decision. - No → Output
sum→ End.
- Yes →
Question 4: Trace Table
"Trace the following algorithm for input n = 7:
ALGORITHM CountDown(n)
While n >= 0:
Print n
n = n - 1
END ALGORITHM"
Trace:
| Step | n | Action |
|---|---|---|
| 1 | 7 | Print 7 |
| 2 | 6 | Print 6 |
| 3 | 5 | Print 5 |
| 4 | 4 | Print 4 |
| 5 | 3 | Print 3 |
| 6 | 2 | Print 2 |
| 7 | 1 | Print 1 |
| 8 | 0 | Print 0 |
| 9 | -1 | Loop ends |
Exam Tip: How to Score Full Marks
For Algorithm Questions:
- Write steps in sequential order with clear actions.
- Use pseudocode-like syntax (e.g.,
IF,WHILE,PRINT). - Label inputs/outputs explicitly (e.g., "Input: marks").
For Flowchart Questions:
- Use standard symbols and label them correctly.
- Show arrows to indicate flow (no crossing lines).
- For decisions, always show both branches (Yes/No).
- Neatness matters: Use a ruler for straight lines.
For Trace Tables:
- List all variables in columns.
- Show every step of the loop/decision.
- Highlight changes in values (e.g.,
n = n - 1).
Common NEB Patterns:
- Design an algorithm for a given problem (e.g., "Find the average of 5 numbers").
- Convert a flowchart to pseudocode or vice versa.
- Trace an algorithm with given inputs.
- Identify errors in a given algorithm/flowchart.
Pro Tip: Practice drawing flowcharts by hand during exams—even if messy, clarity earns marks!
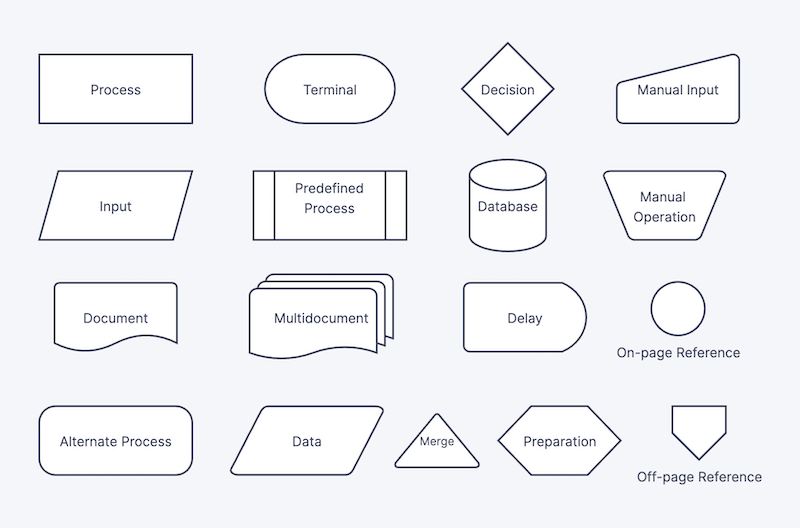 Standard flowchart symbols for NEB exams (Image: Hautit, CC BY-SA 4.0, via Openverse)
Based on the NEB +2 Science syllabus for Computer Science (Comp), unit 6.
Discussion
Loading…