Business Research MethodsUnit 49 min read
Measurement & Scaling: Types, Levels & Applications
Unit 4 of Business Research Methods explores how to quantify and classify data in research, covering measurement scales (nominal, ordinal, interval, ratio), scaling techniques (Likert, semantic differential), and their applications in real-world business problems like customer satisfaction surveys or financial analysis
TAKEAWAYS:
- Measurement scales determine how data is categorized, ordered, or quantified, directly impacting statistical analysis.
- Nominal, ordinal, interval, and ratio scales have distinct properties and appropriate uses (e.g., Likert scales for opinions, ratio scales for financial data).
- Scaling techniques (e.g., Likert, semantic differential) convert qualitative data into quantifiable metrics for analysis.
- Reliability and validity are critical in ensuring measurement accuracy and relevance to research objectives.
- Real-world applications include customer feedback analysis (e.g., Daraz reviews), financial ratios (e.g., Nabil Bank’s loan-to-deposit ratio), and market segmentation (e.g., NTC’s customer satisfaction surveys).
1. What is Measurement in Business Research?
Measurement is the process of assigning numbers or labels to objects, events, or responses to describe their characteristics systematically. In business research, measurement helps convert qualitative data (e.g., customer opinions) into quantitative data (e.g., survey scores) for analysis.
Why is Measurement Important?
- Enables comparison of data (e.g., sales performance across regions).
- Facilitates statistical analysis (e.g., correlation, regression).
- Ensures objectivity in research findings (e.g., employee productivity metrics).
2. Levels of Measurement (Measurement Scales)
Measurement scales classify data based on the type of information they provide. There are four levels, each with unique properties:
Comparison Table: Levels of Measurement
| Scale Type | Definition | Example | Mathematical Operations Allowed | Limitations |
|---|---|---|---|---|
| Nominal | Categories with no order or rank. | Gender (Male/Female), Brand names | Counting (frequency), Mode | Cannot compare or rank categories. |
| Ordinal | Categories with order but no equal intervals. | Customer satisfaction (Poor, Average, Good, Excellent) | Median, Mode, Rank ordering | Cannot calculate differences between ranks. |
| Interval | Ordered categories with equal intervals but no true zero. | Temperature (°C), IQ scores | Mean, Standard deviation, Subtraction | No true zero point (e.g., 0°C ≠ no temperature). |
| Ratio | Ordered categories with equal intervals and a true zero. | Income (Rs. 0 = no income), Weight | Mean, Ratio, Multiplication, Division | Most precise; allows full statistical analysis. |
3. Types of Scaling Techniques
Scaling techniques convert subjective responses into measurable data. Common methods include:
A. Likert Scale
- Measures attitudes or opinions on a symmetric agree-disagree scale (e.g., 1 = Strongly Disagree to 5 = Strongly Agree).
- Example: A Daraz customer satisfaction survey asks:
"How satisfied are you with your delivery experience?"
- 1 (Very Dissatisfied) to 5 (Very Satisfied).
Advantages:
- Simple and easy to administer.
- Provides quantifiable data for statistical analysis.
Disadvantages:
- No true zero (interval scale).
- Responses may lack depth (e.g., "Neutral" is ambiguous).
B. Semantic Differential Scale
- Measures conceptual meanings using bipolar adjectives (e.g., "Good" vs. "Bad").
- Example: For a NTC customer survey:
"How would you rate NTC’s customer service?"
- Poor (1) ———— Excellent (7)
Advantages:
- Captures nuanced opinions.
- Useful for brand perception studies.
Disadvantages:
- Requires careful wording to avoid bias.
- Interpretation can be subjective.
C. Graphic Rating Scale
- Uses a visual continuum (e.g., a line from "Very Low" to "Very High").
- Example: Rating Pathao’s driver reliability on a 10-cm line.
Advantages:
- Flexible and visually intuitive.
- Reduces forced choices.
Disadvantages:
- Hard to quantify without numerical anchors.
- Prone to response bias (e.g., central tendency).
D. Rank Order Scale
- Respondents rank items in order of preference.
- Example: Ranking banks (Nabil, Global IME, Standard Chartered) based on customer service.
Advantages:
- Simple and quick to administer.
- Useful for relative comparisons.
Disadvantages:
- No information on magnitude of difference (e.g., why Bank A > Bank B).
- Ties are difficult to handle.
4. Real-World Applications of Measurement & Scaling
In the Real World
eSewa & Khalti (Digital Payments)
- Idea Used: Ratio Scale Measurement
- How? Transaction amounts (Rs. 0 = no transaction) are measured on a ratio scale to analyze spending patterns, fraud detection, and user behavior.
Daraz (E-Commerce)
- Idea Used: Likert Scale for Customer Feedback
- How? Product reviews use a 1–5 Likert scale to measure satisfaction, which Daraz uses to improve inventory and logistics.
NTC (Telecom)
- Idea Used: Semantic Differential Scale for Brand Perception
- How? Surveys ask customers to rate NTC on scales like "Fast Service" (1–7) to track service quality improvements.
Worked Example: Measuring Customer Satisfaction at a Bank (Nabil Bank)
Scenario: Nabil Bank wants to measure customer satisfaction with its loan services. Approach:
- Scale Choice: Use a 5-point Likert scale for questions like:
- "How satisfied are you with the loan approval process?" (1 = Very Dissatisfied to 5 = Very Satisfied).
- Data Collection: Survey 500 customers.
- Analysis:
- Calculate the mean satisfaction score (e.g., 3.8/5).
- Compare scores across branches to identify high/low performers.
- Action: Improve processes in low-scoring branches (e.g., faster approvals).
Visualization: Likert Scale in Action
mindmap
  root((Nabil Bank Loan Satisfaction Survey))
    Likert Scale (1-5)
      1: Very Dissatisfied
      2: Dissatisfied
      3: Neutral
      4: Satisfied
      5: Very Satisfied
    Sample Question
      "How satisfied are you with the interest rate transparency?"
    Data Analysis
      Mean Score: 3.8
      Branch Comparison: Kathmandu (4.2) vs. Pokhara (3.5)
    Action Plan
      Improve transparency in Pokhara branch
5. Reliability and Validity in Measurement
For measurements to be useful, they must be:
- Reliable: Consistent results over time (e.g., same survey yields similar scores).
- Valid: Measures what it claims to measure (e.g., a "satisfaction" scale actually measures satisfaction, not price perception).
How to Ensure Reliability & Validity?
| Aspect | Reliability Check | Validity Check |
|---|---|---|
| Test-Retest | Administer the same survey twice. | Does the scale measure the intended construct? |
| Internal Consistency | Cronbach’s Alpha (>0.7 is good). | Do all questions relate to the same topic? |
| Face Validity | Does the scale "look" valid? | Expert review of survey questions. |
Example: If a NEPSE stock performance survey uses a 1–10 scale but asks about "employee happiness", it lacks validity because it measures the wrong construct.
6. Common Mistakes to Avoid
Using the Wrong Scale:
- ❌ Measuring temperature in °C as a ratio scale (it’s interval).
- ✅ Use ratio scale for income (Rs. 0 = no income).
Ambiguous Questions:
- ❌ "How good is our service?" (No scale provided).
- ✅ "Rate our service on a scale of 1–5."
Ignoring Reliability:
- ❌ Using a survey with low Cronbach’s Alpha (<0.6).
- ✅ Pilot-test the survey before full deployment.
Exam Tip
How This Unit is Tested in PU Exams
Definitions & Differences:
- Expect short-answer questions on nominal vs. ordinal scales.
- Example: "Distinguish between interval and ratio scales with examples."
Application-Based Questions:
- Case studies (e.g., "How would you measure customer loyalty for Pathao?").
- Worked examples (e.g., "Given a Likert scale data, calculate the mean satisfaction score.").
Critical Thinking:
- "Why is a Likert scale better than a rank order scale for measuring brand perception?"
- "How would you ensure the validity of a survey measuring employee morale at Himalayan Java?"
Diagram-Based Questions:
- Draw and label a Likert scale or semantic differential scale.
- Explain how a ratio scale differs from an interval scale in a table.
Key Formula to Remember:
- Mean (Likert Scale) = (Σ Scores) / (Number of Responses) Example: If 100 customers rate satisfaction as 4, 3, 5, etc., sum all scores and divide by 100.
Final Checklist for Full Marks
✅ Know the 4 scales (nominal, ordinal, interval, ratio) and their properties. ✅ Understand scaling techniques (Likert, semantic differential, rank order). ✅ Apply concepts to real businesses (e.g., Daraz reviews, NTC surveys). ✅ Calculate mean scores from Likert data. ✅ Explain reliability and validity with examples. ✅ Practice drawing scales (Likert, semantic differential).
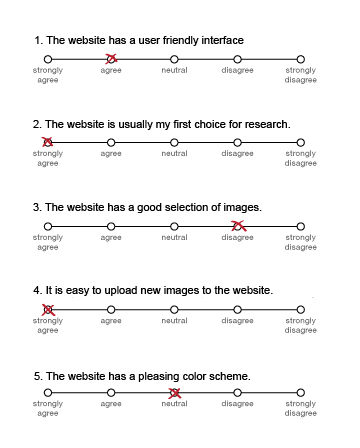 A labelled Likert scale (1-5) for customer satisfaction. (Image: Nicholas Smith, CC BY-SA 3.0, via Wikimedia Commons)
Based on the PU BBA (PU) syllabus for Business Research Methods, unit 4.
Discussion
Loading…