Data Science and AnalyticsUnit 514 min read
Statistical Inference: Sampling, Estimation, Hypothesis Testing
Unit 5 of Data Science and Analytics explores how to draw reliable conclusions from data using statistical inference, covering sampling methods, point/interval estimation, hypothesis testing (t-tests, chi-square), and confidence intervals with real-world applications in Nepalese tech and finance.
What is Statistical Inference?
Statistical inference is the process of drawing conclusions about a population based on a sample of data. Unlike descriptive statistics (which summarize data), inference allows us to make predictions, test hypotheses, and estimate population parameters with a measure of uncertainty.
Key Concepts:
- Population: The entire group of interest (e.g., all Nepali smartphone users).
- Sample: A subset of the population used for analysis (e.g., 1,000 smartphone users surveyed in Kathmandu).
- Parameter: A numerical summary of a population (e.g., mean income of all Nepali households).
- Statistic: A numerical summary of a sample (e.g., mean income of sampled households).
Sampling Methods
Sampling is critical because analyzing an entire population is often impractical. Common sampling techniques include:
1. Probability Sampling
- Simple Random Sampling: Every member has an equal chance of being selected (e.g., randomly selecting 500 Ncell customers for a survey).
- Stratified Sampling: Population divided into subgroups (strata) and samples taken from each (e.g., surveying students from each grade level in TU).
- Cluster Sampling: Population divided into clusters, and entire clusters are randomly selected (e.g., surveying all households in 10 randomly chosen wards of Kathmandu).
- Systematic Sampling: Selecting every k-th member from a list (e.g., surveying every 100th customer at Daraz).
2. Non-Probability Sampling
- Convenience Sampling: Selecting easily accessible members (e.g., surveying TU students in Dharan campus).
- Purposive Sampling: Selecting members based on specific criteria (e.g., interviewing top 100 NEPSE traders).
- Snowball Sampling: Using existing subjects to recruit more (e.g., asking WhatsApp users to refer friends for a digital payment study).
graph TD
A["Sampling Methods"] --> B["Probability Sampling"]
A --> C["Non-Probability Sampling"]
B --> B1["Simple Random"]
B --> B2["Stratified"]
B --> B3["Cluster"]
B --> B4["Systematic"]
C --> C1["Convenience"]
C --> C2["Purposive"]
C --> C3["Snowball"]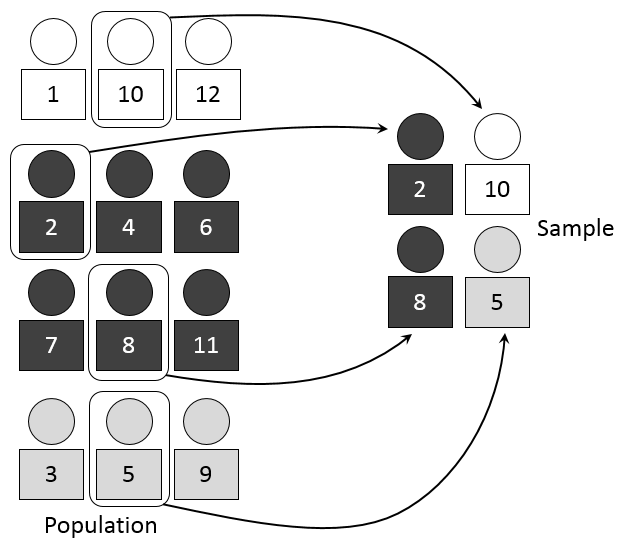 Stratified sampling divides the population into homogeneous subgroups before sampling. (Image: Dan Kernler, CC BY-SA 4.0, via Wikimedia Commons)
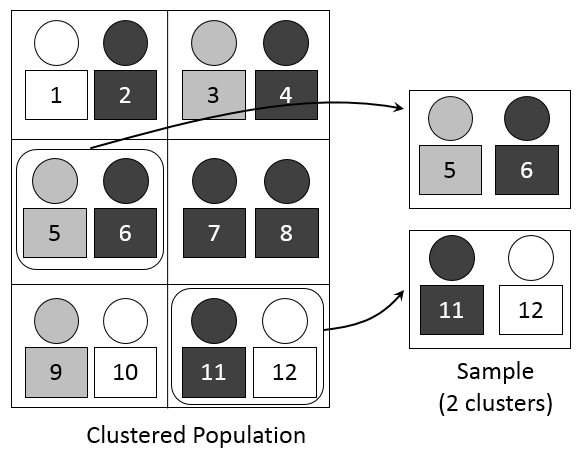 Cluster sampling groups the population into clusters and randomly selects entire clusters. (Image: Dan Kernler, CC BY-SA 4.0, via Wikimedia Commons)
Estimation: Point and Interval
Estimation involves using sample data to approximate population parameters.
1. Point Estimation
A single value estimate of a population parameter (e.g., sample mean as an estimate of population mean ).
Example: Suppose you survey 100 Pathao drivers in Pokhara and find their average daily earnings are Rs. 2,500. This is your point estimate for the average earnings of all Pathao drivers in Nepal.
2. Interval Estimation (Confidence Intervals)
A range of values likely to contain the population parameter, with a certain confidence level (e.g., 95% confidence).
Formula for Confidence Interval of Mean (Population Standard Deviation Known):
- : Sample mean
- : Z-score (e.g., 1.96 for 95% confidence)
- : Population standard deviation
- : Sample size
Worked Example (Nepali Context): A bank wants to estimate the average loan amount taken by small businesses in Nepal. A sample of 50 businesses shows:
- Sample mean () = Rs. 500,000
- Sample standard deviation () = Rs. 50,000
- Confidence level = 95% (z = 1.96)
Since the population standard deviation () is unknown, we use the t-distribution: For 95% confidence and , . Confidence Interval: Rs. 485,755 to Rs. 514,245.
Hypothesis Testing
Hypothesis testing determines whether there is enough evidence to support a claim about a population.
Steps:
- State Hypotheses:
- Null hypothesis (): Default assumption (e.g., "The new eSewa feature does not increase user engagement").
- Alternative hypothesis (): Claim to test (e.g., "The new eSewa feature increases user engagement").
- Choose Significance Level (): Commonly 0.05 (5% chance of rejecting when it’s true).
- Calculate Test Statistic: Depends on the test (e.g., z-test, t-test, chi-square).
- Determine p-value: Probability of observing the data if is true.
- Make Decision:
- If , reject (statistically significant).
- If , fail to reject .
Common Tests:
| Test | When to Use | Formula |
|---|---|---|
| Z-test | Compare sample mean to population mean (large , known). | |
| t-test | Compare sample mean to population mean (small , unknown). | |
| Chi-square () | Test independence or goodness-of-fit (categorical data). | |
| ANOVA | Compare means of >2 groups. |
In the Real World
Statistical inference is used everywhere in Nepal’s tech and finance sectors:
eSewa and Khalti:
- A/B Testing: eSewa tests whether a new "Quick Pay" button increases transaction success rates. They split users into two groups (control vs. test) and use hypothesis testing to decide if the change is significant.
- Example: If 60% of users in the test group complete payments vs. 55% in the control group, a z-test determines if this 5% increase is statistically significant.
Ncell Customer Churn Prediction:
- Ncell uses logistic regression (a classification model) to predict which customers might leave. They collect data on call duration, data usage, and bill payments, then test hypotheses like:
- "Do customers with <30 minutes of monthly call time churn more often?"
- A chi-square test checks if call duration is independent of churn status.
- Ncell uses logistic regression (a classification model) to predict which customers might leave. They collect data on call duration, data usage, and bill payments, then test hypotheses like:
NEPSE Stock Market Analysis:
- Analysts use confidence intervals to estimate the true return of a stock (e.g., Nabil Bank’s dividend yield). If a sample of 100 investors shows an average yield of 8% with a 95% CI of [7.5%, 8.5%], they can advise clients with confidence.
- Hypothesis Test Example: "Does the new government policy increase NEPSE’s volatility?" Traders test this by comparing pre- and post-policy stock price fluctuations using a t-test.
Daraz Delivery Time Optimization:
- Daraz uses stratified sampling to survey customers in different cities (Kathmandu, Pokhara, Biratnagar) to estimate average delivery delays. They then test if delays differ significantly across regions using ANOVA.
NTC Internet Speed Claims:
- NTC advertises "average download speed of 50 Mbps." To verify, they take a sample of 200 users and construct a 95% confidence interval. If the interval is [45 Mbps, 55 Mbps], they can confidently claim their average is 50 Mbps.
Types of Errors in Hypothesis Testing
No test is perfect. Two types of errors can occur:
| Error Type | Definition | Example |
|---|---|---|
| Type I Error | Rejecting when it’s true (false positive). | Claiming a new WhatsApp feature increases usage when it actually doesn’t. |
| Type II Error | Failing to reject when it’s false (false negative). | Missing that a Daraz discount actually reduces cart abandonment. |
Trade-off: Reducing (Type I error) increases (Type II error), and vice versa.
Worked Example: Kathmandu Traffic Congestion Study
Scenario: The Kathmandu Metropolitan City (KMC) wants to test if the average travel time during peak hours (7–9 AM) exceeds 45 minutes. They collect data from 30 drivers:
- Sample mean () = 50 minutes
- Sample standard deviation () = 8 minutes
- Significance level () = 0.05
Step 1: State Hypotheses
- : minutes (travel time is not worse than 45 minutes)
- : minutes (travel time exceeds 45 minutes; one-tailed test)
Step 2: Choose Test Since is unknown and (small), use a one-sample t-test.
Step 3: Calculate Test Statistic
Step 4: Find Critical Value and p-value
- Degrees of freedom () =
- For (one-tailed), critical ≈ 1.699.
- Since 3.42 > 1.699, reject .
- p-value ≈ 0.001 (from t-table), which is < 0.05.
Conclusion: There is strong evidence that the average travel time exceeds 45 minutes. KMC should consider traffic management policies.
Comparing Statistical Tests
Not sure which test to use? Here’s a quick guide:
| Scenario | Test | Assumptions |
|---|---|---|
| Compare sample mean to known | Z-test or t-test | Normal distribution (or large for CLT). |
| Compare two means (independent) | Independent t-test | Normality, equal variances (check with Levene’s test). |
| Compare two means (paired) | Paired t-test | Differences are normally distributed. |
| Compare >2 means | ANOVA | Normality, homogeneity of variance. |
| Test categorical data independence | Chi-square test | Expected frequencies >5 in each cell. |
| Test goodness-of-fit | Chi-square test | Observed and expected frequencies defined. |
Exam Tip
For Pokhara University exams, focus on these high-yield areas:
Sampling Methods:
- Know the difference between probability and non-probability sampling.
- Be able to critique convenience sampling (e.g., "Why might a TU student survey bias results?").
- Exam Question: "Design a stratified sampling plan to estimate the average monthly data usage of Ncell prepaid users in Nepal."
Confidence Intervals:
- Memorize the formula for mean and proportion intervals.
- Worked Example: Given a sample of 100 NEPSE traders with average profit Rs. 200,000 and , calculate the 90% CI for the mean profit.
- Common Mistake: Forgetting to use instead of for small samples.
Hypothesis Testing:
- Steps: Write them out clearly in exams (state , choose , calculate test statistic, decide).
- Interpretation: Know how to phrase conclusions (e.g., "Reject at 5% significance level" vs. "Insufficient evidence").
- Exam Question: "A bank claims its loan approval rate is 60%. A sample of 200 applicants shows 110 approvals. Test at ."
Type I vs. Type II Errors:
- Application: Relate to real-world consequences (e.g., "A Type I error in medical testing could lead to unnecessary treatments").
- Exam Question: "In a Daraz quality control test, which error is worse: rejecting a good product or accepting a defective one? Why?"
Visuals:
- Always draw:
- A confidence interval on a number line (label , margin of error, and CI bounds).
- A hypothesis testing decision rule (shade the rejection region on a t/z distribution).
- Example: For a two-tailed test at , sketch a normal curve with critical values at .
- Always draw:
Real-World Links:
- Expect questions tying concepts to Nepali contexts (e.g., "How would NTC use confidence intervals to advertise internet speeds?").
- Avoid generic examples: Use eSewa, Khalti, Ncell, Daraz, or NEPSE in your answers to stand out.
Common Pitfalls
- Ignoring Assumptions: Always check normality, independence, and equal variance before running a t-test or ANOVA.
- Misinterpreting p-values: A p-value of 0.05 does not mean "95% confidence." It means there’s a 5% chance of observing the data if is true.
- Overlooking Effect Size: A statistically significant result may not be practically meaningful (e.g., a 1% increase in Khalti transactions).
- Confounding Variables: In observational studies (e.g., "Does Pathao usage increase with income?"), ensure other factors (like age or location) are controlled.
Summary Table: Key Formulas
| Concept | Formula |
|---|---|
| Confidence Interval (Mean) | |
| Confidence Interval (Proportion) | |
| Z-test Statistic | |
| t-test Statistic | |
| Chi-square Statistic | |
| Margin of Error | (for proportions: ) |
Based on the PU BE Computer (PU) syllabus for Data Science and Analytics (CMP422), unit 5.
Discussion
Loading…