StatisticsUnit 105 min read
Index Numbers & Time Series: Trends, Forecasting & Analysis
Unit 10 of Statistics covers index numbers (price, quantity, value indices) and time series (components, decomposition, forecasting), with real-world applications in inflation, hotel demand, and stock markets.
Key Concepts & Definitions
1. Index Numbers
An index number is a statistical measure that shows changes in a variable (price, quantity, value) over time, relative to a base period (usually 100).
Types of Index Numbers
Weighted vs. Unweighted Index
| Feature | Unweighted Index | Weighted Index |
|---|---|---|
| Formula | Simple average | Uses weights (importance) |
| Example | Simple price index | CPI (weights = % of household spending) |
| Use Case | Small datasets | Large datasets (economy-wide) |
Worked Example 1: Price Index Given:
- Base year (2020) prices: (Rs.)
- Current year (2023) prices: (Rs.)
- Quantities in 2020:
Calculate the price index for 2023 (base = 2020). Interpretation: Prices in 2023 are 80.95% of 2020 levels (a 19.05% decrease).
2. Time Series Analysis
A time series is a collection of observations ordered by time (e.g., daily hotel bookings, monthly inflation).
Components of Time Series
Decomposition Methods
- Additive Model:
- Used when seasonality is constant (e.g., fixed monthly sales).
- Multiplicative Model:
- Used when seasonality grows with trend (e.g., hotel bookings).
Worked Example 2: Trend Analysis Given: Quarterly sales (in Rs. lakhs) for a hotel:
| Quarter | 2022 | 2023 |
|---|---|---|
| Q1 | 50 | 60 |
| Q2 | 45 | 55 |
| Q3 | 60 | 70 |
| Q4 | 70 | 80 |
Plot the trend (ignore seasonality for now): Observation: Sales are increasing by ~10 lakhs/year (trend).
In the Real World
eSewa/Khalti (Nepal):
- Uses price indices to adjust transaction fees for inflation.
- Example: If CPI rises from 100 to 110, fees may increase by 10% to maintain revenue.
NEPSE (Nepal Stock Exchange):
- Publishes the Nepal Stock Index (Nepse Index), a weighted price index tracking 50+ stocks.
- Formula: .
Hotel Demand Forecasting (Pathao/Booking.com):
- Uses time series decomposition to predict peak seasons (e.g., Dashain, Christmas).
- Example: If Q4 sales are always 30% higher than Q1, the system auto-adjusts room prices.
Applications in Hotel Management
| Scenario | Index/Time Series Tool | Example Calculation |
|---|---|---|
| Menu price adjustments | Price Index (CPI) | If CPI rises by 5%, increase menu prices by 5%. |
| Staff scheduling | Seasonality Analysis | Hire 20% more staff in Dec vs. Jan. |
| Revenue forecasting | Trend + Cyclical Components | Predict 15% YoY growth if economy recovers. |
| Cost control | Value Index (Input Costs) | If flour price index rises by 10%, adjust pastry costs. |
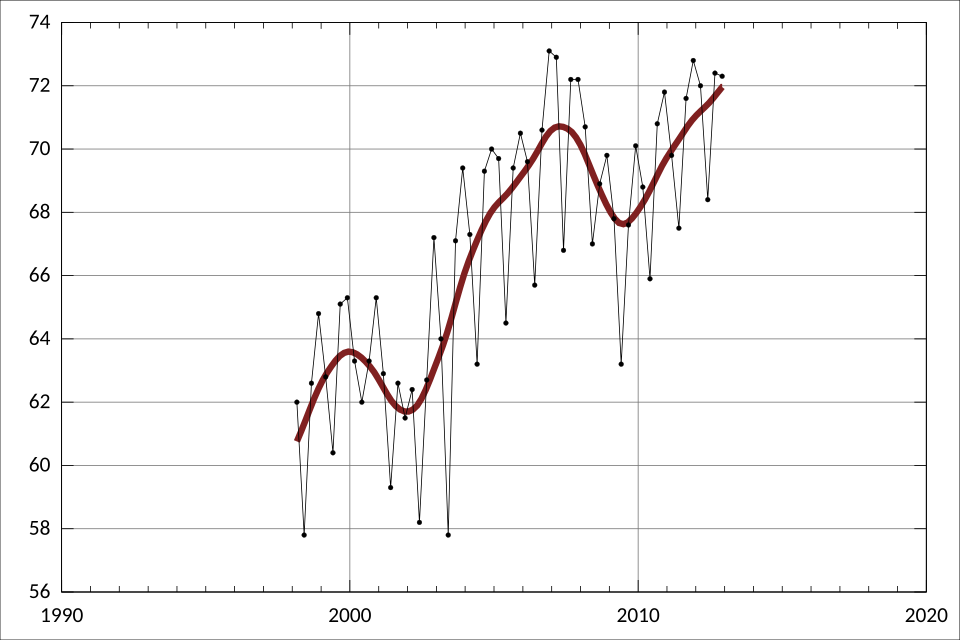 Example of a hotel occupancy index used in practice (Image: Toby Hudson, CC BY-SA 3.0 au, via Wikimedia Commons)
Exam Tip
Index Numbers:
- Always define the base year clearly.
- For weighted indices, show the weight calculation (e.g., % of total expenditure).
- Common mistake: Forgetting to multiply by 100 in the final index formula.
Time Series:
- Plot the data (even in exams) to identify trends/seasonality.
- For decomposition, state whether additive or multiplicative is used.
- Forecasting: Use the last observed trend if no other method is given (e.g., "Sales increased by 5 lakhs/year; next year’s forecast = current sales + 5").
Real-World Links:
- NEPSE, eSewa, and hotel chains love time series for decision-making.
- Inflation adjustments (e.g., salary hikes) use price indices.
Practice Question: Given the following data for a hotel’s monthly electricity bills (Rs. lakhs):
| Month | 2022 | 2023 |
|---|---|---|
| Jan | 20 | 22 |
| Feb | 18 | 20 |
| Mar | 25 | 28 |
- Calculate the price index for 2023 (base = 2022).
- Identify the trend and seasonality (if any).
- Forecast the April 2023 bill assuming the trend continues.
(Hint: Use the additive model for decomposition.)
Based on the TU BHM syllabus for Statistics (STT311), unit 10.
Discussion
Loading…