StatisticsUnit 38 min read
Measures of Central Tendency: Mean, Median, Mode, GM, and HM
Unit 3 of Statistics: This note covers the concepts, mathematical formulas, and practical applications of various averages used to summarize data sets into a single representative value for decision-making in hotel management.
Key points
- Central tendency provides a single value that represents the center of a data distribution.
- The Arithmetic Mean is the most common average but is highly sensitive to extreme values (outliers).
- The Median is the best measure for skewed data or ordinal data as it represents the exact middle.
- The Mode identifies the most frequent observation, which is crucial for inventory and menu planning.
- Geometric and Harmonic means are specialized averages used for growth rates and speed/average rates respectively.
- The empirical relationship between the three main measures is \( \text{Mode} = 3\text{Median} - 2\text{Mean} \).
Introduction to Central Tendency
In the hospitality industry, managers deal with vast amounts of data—daily room occupancy, food costs, guest satisfaction scores, and employee payroll. Analyzing every single data point is impossible. Therefore, we use Measures of Central Tendency, also known as "averages."
A measure of central tendency is a single value that attempts to describe a set of data by identifying the central position within that set of data.
flowchart TD
A["Measures of Central Tendency"] --> B["Mathematical Averages"]
A --> C["Positional Averages"]
B --> B1["Arithmetic Mean"]
B --> B2["Geometric Mean"]
B --> B3["Harmonic Mean"]
C --> C1["Median"]
C --> C2["Mode"] A hotel front desk where guest data is collected for statistical analysis. (Image: Basile Morin, CC BY-SA 4.0, via Wikimedia Commons)
1. Arithmetic Mean (AM)
The Arithmetic Mean is the sum of all observations divided by the total number of observations. It is the most widely used measure of central tendency.
Types of Mean
- Simple Arithmetic Mean: Every observation is given equal importance.
- Weighted Arithmetic Mean: Different observations are given different weights based on their importance.
Calculation Methods
A. Individual Series (Raw Data): Where is the sum of values and is the number of items.
B. Discrete Series (Frequency Data): Where is the frequency of each value .
C. Continuous Series (Grouped Data): Where is the midpoint of each class interval: .
Worked Example: Average Daily Revenue
A boutique hotel in Pokhara records the daily room revenue (in NPR) for 5 days: 12,000, 15,000, 11,000, 18,000, and 14,000.
Step 1: Sum the values
Step 2: Divide by number of days (n=5) The average daily revenue is NPR 14,000.
Weighted Arithmetic Mean
Used when some data points contribute more to the final average than others.
Example: A student's final grade is based on Assignments (20%), Mid-term (30%), and Final Exam (50%). If they score 80, 70, and 60 respectively:
2. Median
The Median is the middle-most value of a data set when the observations are arranged in ascending or descending order. It divides the data into two equal halves.
Calculation Methods
A. Individual Series:
- Arrange data in order.
- If is odd: Median = Value of term.
- If is even: Median = Average of and terms.
B. Continuous Series: Where:
- : Lower limit of the median class.
- : Total frequency.
- : Cumulative frequency of the class preceding the median class.
- : Frequency of the median class.
- : Class width.
Worked Example: Guest Age
A hotel collects the ages of 7 guests: 22, 45, 30, 22, 50, 65, 38.
Step 1: Arrange in ascending order 22, 22, 30, 38, 45, 50, 65
Step 2: Find the position Since (odd), position = term.
Step 3: Identify value The 4th term is 38. Median Age = 38 years.
3. Mode
The Mode is the value that appears most frequently in a data set. A distribution can be unimodal (one mode), bimodal (two modes), or multimodal.
Calculation Methods
A. Individual/Discrete Series: The value with the highest frequency is the mode.
B. Continuous Series: Where:
- : Lower limit of the modal class.
- : Frequency of the modal class.
- : Frequency of the class preceding the modal class.
- : Frequency of the class succeeding the modal class.
- : Class width.
Worked Example: Popular Dish
A restaurant tracks the number of orders for 5 different dishes over a weekend:
- Momo: 120
- Chowmein: 80
- Thukpa: 40
- Pizza: 120
- Burger: 60
Since Momo and Pizza both have the highest frequency (120), this data is Bimodal. Modes = Momo and Pizza.
4. Geometric Mean (GM) and Harmonic Mean (HM)
Geometric Mean (GM)
The GM is the root of the product of observations. It is primarily used for calculating average growth rates, percentages, and ratios.
Example: If a hotel's occupancy grew by 5% in year one and 15% in year two, the average growth is found using GM.
Harmonic Mean (HM)
The HM is the reciprocal of the arithmetic mean of the reciprocals of the observations. It is used for calculating average speeds or average rates.
Example: If a delivery bike travels from a hotel to a customer at 20 km/h and returns at 30 km/h, the average speed for the round trip is the HM.
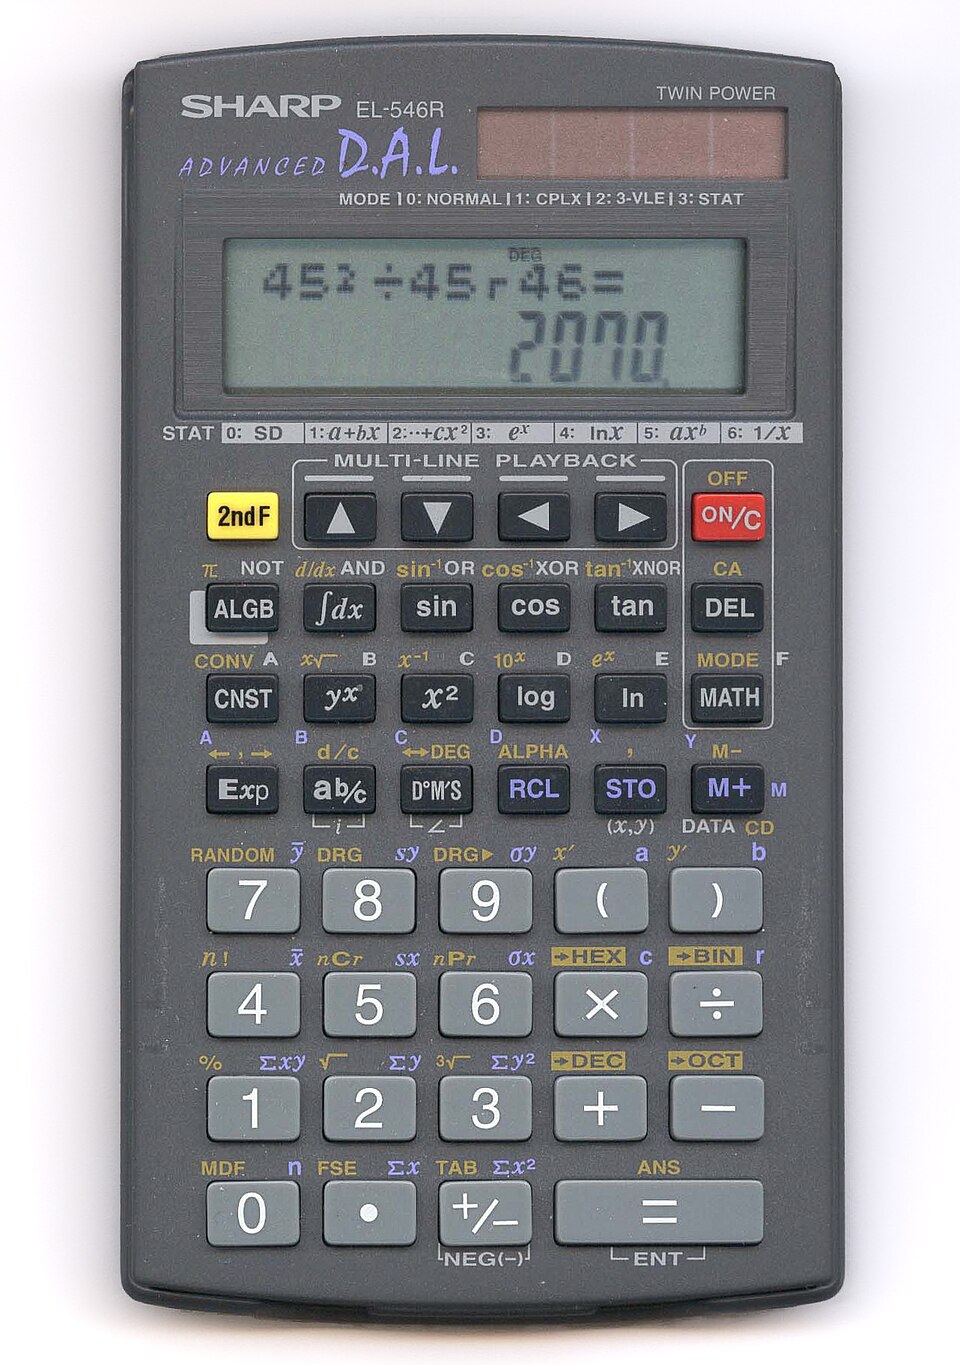 A tool used to calculate roots for GM and reciprocals for HM. (Image: Matti Blume, CC BY-SA 2.0, via Wikimedia Commons)
Comparison of Mean, Median, and Mode
| Feature | Arithmetic Mean | Median | Mode |
|---|---|---|---|
| Definition | Mathematical average | Middle value | Most frequent value |
| Sensitivity | Highly affected by outliers | Not affected by outliers | Not affected by outliers |
| Data Type | Quantitative (Interval/Ratio) | Quantitative or Ordinal | Quantitative or Nominal |
| Use Case | General purpose summary | Skewed data (e.g., Salaries) | Popularity/Inventory |
| Uniqueness | Always unique | Always unique | Can be multiple or none |
Relationship between Mean, Median, and Mode
For a moderately skewed distribution, the empirical relationship is:
Example: If the Mean of a hotel's guest rating is 4.2 and the Median is 4.4, find the Mode.
In the real world
- Pathao/InDrive (Mean): These apps calculate the "Average Estimated Time of Arrival (ETA)." They use the Arithmetic Mean of recent trips on the same route to give you a realistic waiting time.
- Daraz (Median): When Daraz shows "Average Delivery Time," they often use the Median instead of the Mean. This is because a few extremely delayed packages (outliers) would make the Mean look very high, which would discourage customers. The Median provides a more "typical" experience.
- Hotel Menu Planning (Mode): A hotel chef looks at the Mode of the "Daily Special" orders. If "Chicken Curry" is the mode (most ordered), the chef increases the procurement of chicken for the next week to avoid stock-outs.
- NEPSE (Geometric Mean): Investors in the Nepal Stock Exchange use the Geometric Mean to calculate the Compound Annual Growth Rate (CAGR) of their portfolio over several years, as stock returns are multiplicative, not additive.
Exam tip
- Identify the Series: Before starting any calculation, check if the data is Individual (raw list), Discrete (value + frequency), or Continuous (class intervals). Using the wrong formula is the most common cause of marks loss.
- Median Class: In continuous series, always calculate the Cumulative Frequency (cf) first to find the Median Class.
- Modal Class: The modal class is simply the one with the highest frequency.
- Outliers: If the question asks "Which measure is best for this data?" and you see a value that is much larger or smaller than the rest (e.g., salaries: 20k, 22k, 21k, 500k), always choose the Median.
- Formula Precision: Write the general formula first before substituting values. TU examiners give step-marks for the correct formula even if the final calculation is wrong.
Based on the TU BHM syllabus for Statistics (STT311), unit 3.
Discussion
Loading…